REPRODUCIBLE REPLAY BATCH
Testing one setup across ten replay sessions: keep the whole journal
Repeating a rule is more informative than collecting a single attractive screenshot, but a short replay batch still cannot establish a trading edge. We ran a fixed first-bullish-close exercise across two five-weekday blocks in September 2025. This article publishes all ten gross outcomes, explains why the second block was added and shows how to reproduce the calculation with ReplayPip’s actual trade engine.
State the question and disclose the sample
The question was operational: can we apply the same entry, position size and exit procedure repeatedly without rewriting the plan? The first block was 15–19 September 2025. After it produced five gross gains, we added 22–26 September to find a losing teaching example. Both blocks are retained. The earlier 17 September article was already known, so this is not an untouched holdout set.
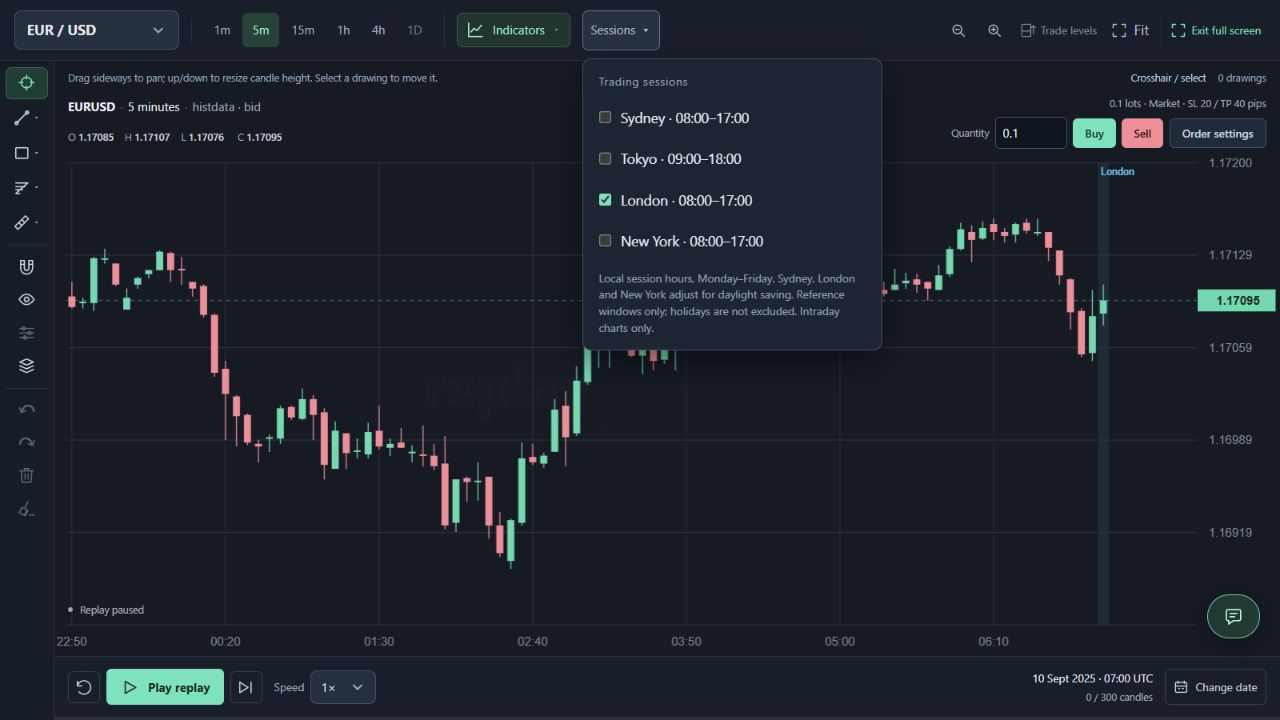
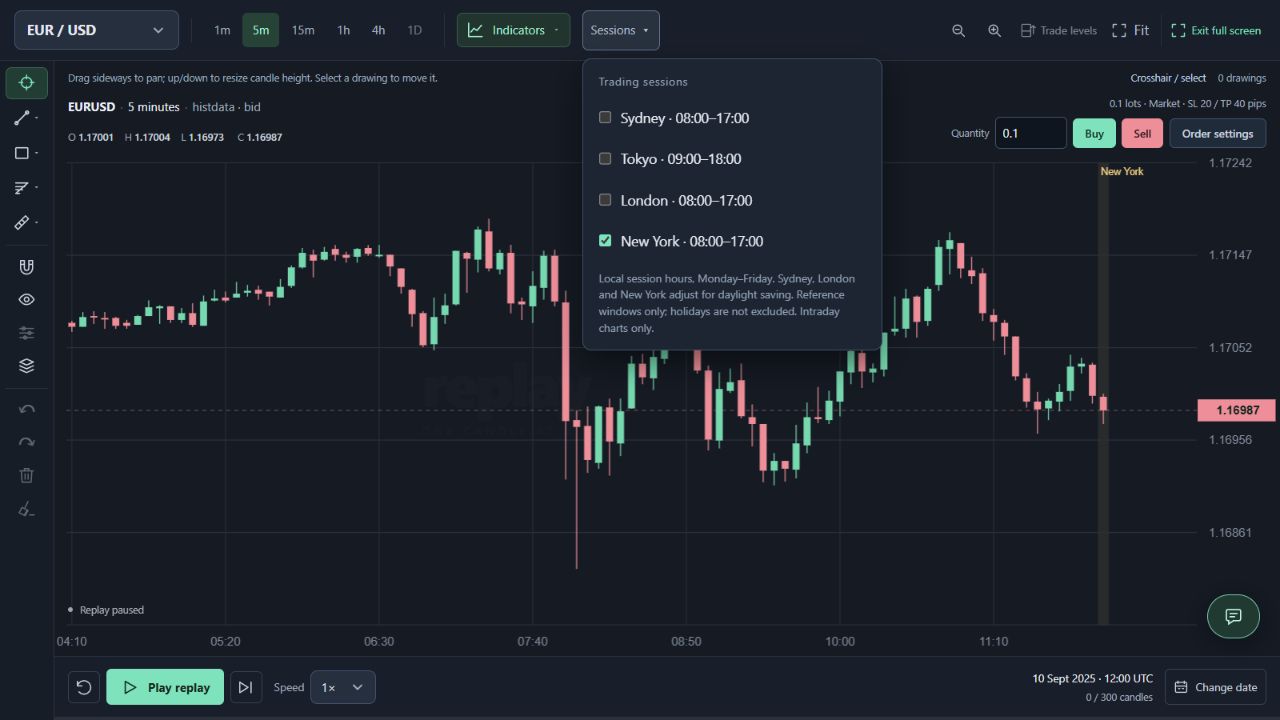
These are ten weekday replay windows at 09:00 UTC, not a comparison of the complete London and New York trading sessions. We do not claim the dates represent all volatility regimes, news environments or market conditions. Choosing another block after seeing the first introduces a stopping/selection decision that belongs in the record.
Use one unchanged rule version
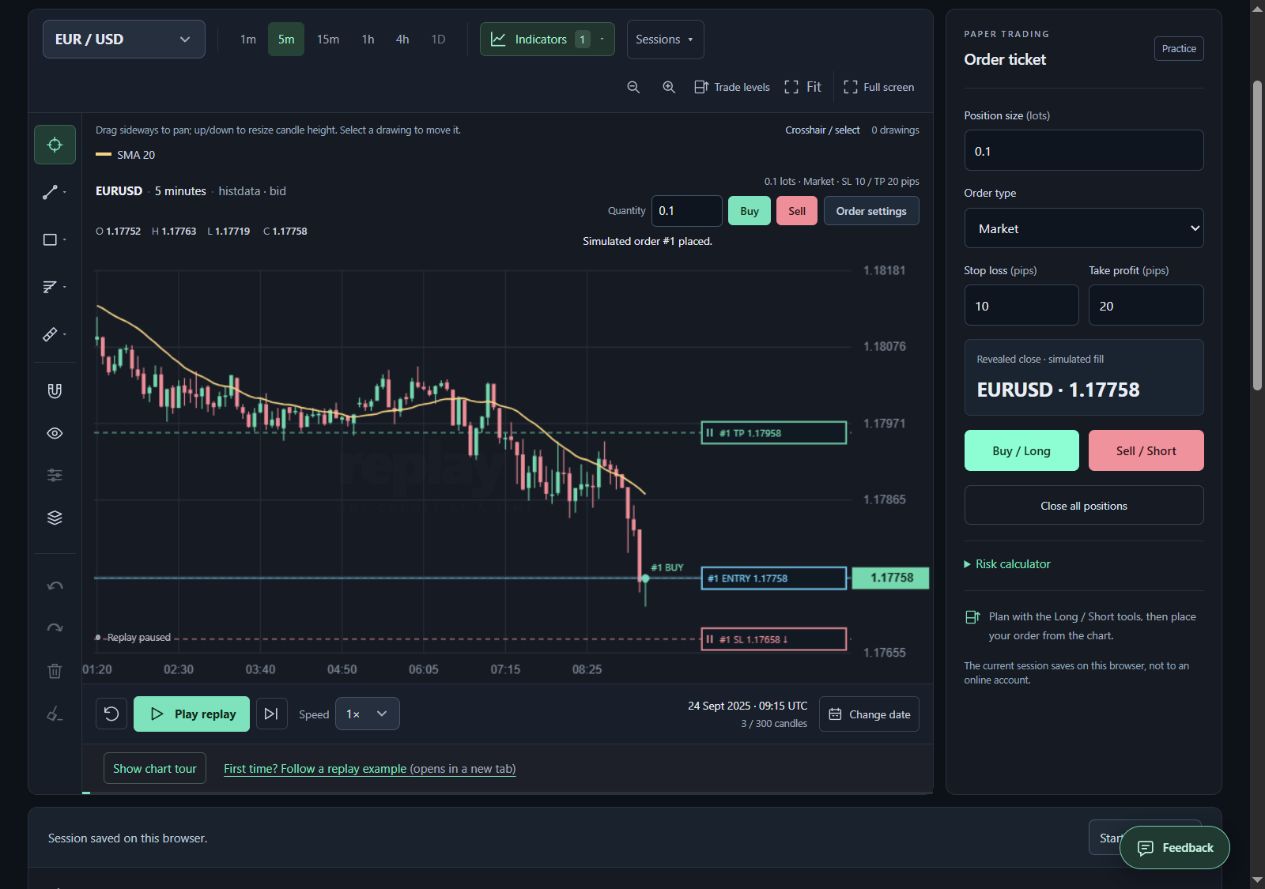
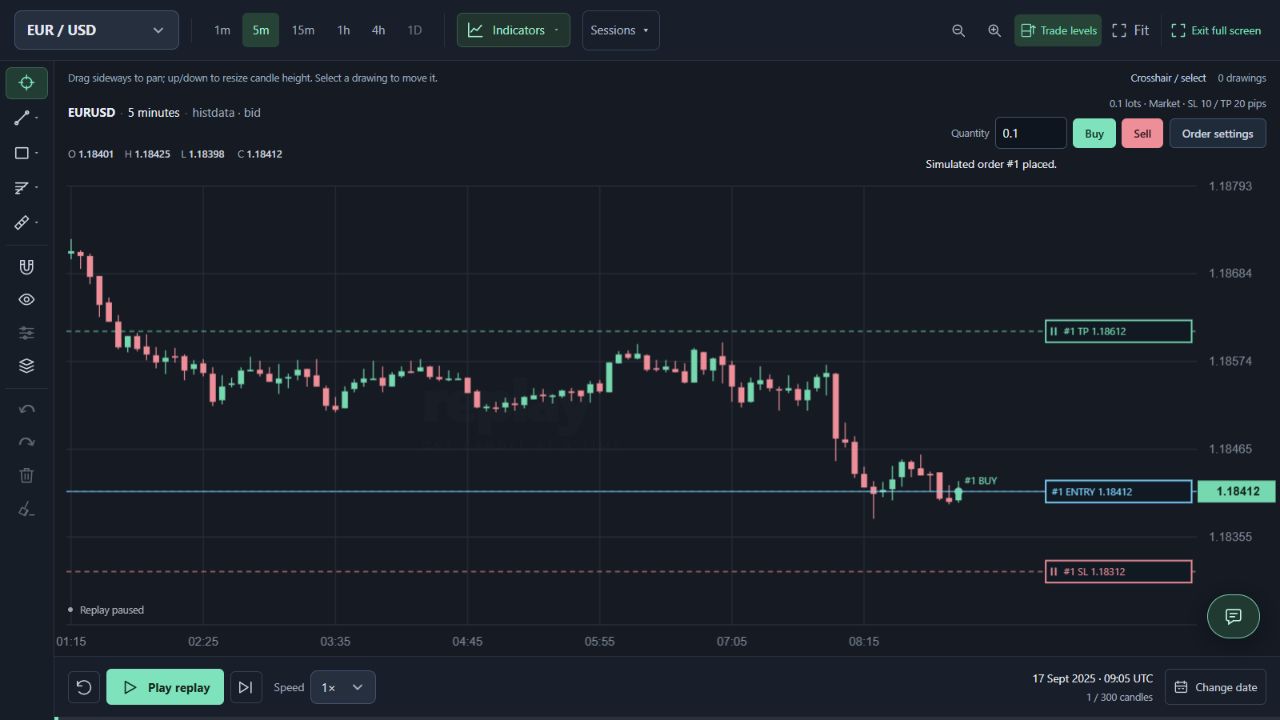
Version A1 uses EUR/USD, five-minute complete candles and HistData bid prices. Starting at 09:00 UTC, buy the first revealed close above its open by 10:00 inclusive; otherwise skip. Use 0.10 lots, a 10-pip stop and a 20-pip target. Allow one trade, no adjustments, and close after 12 subsequent candles if neither level has closed it.
The scripts verify that the required five-minute candles are continuous instead of compressing a missing interval into a shorter holding period. All ten selected windows had complete data and qualified. A different sample could contain skipped or incomplete sessions; record those explicitly rather than quietly replacing them. Times below are candle-opening labels, not real-time knowledge of the candle close.
Why missing candles affect your backtest—and how to check them
First block: retain all five gross gains
All five exits were Manual after the fixed hold. Gross results were +4.30, +7.70, +6.00, +1.80 and +6.50 USD: +26.30 USD total. We did not increase size after a gain. Each trade used 10 USD of initial price risk, independent of earlier results.
Five wins can look impressive, yet the total is sensitive to assumptions. Under the separate invented 5.20 USD round-trip cost per trade, the block becomes only +0.30 USD. That deduction is an arithmetic scenario, not a reconstruction of executable historical fills.
| UTC date | Entry label | Exit label | Gross USD |
|---|---|---|---|
| 2025-09-15 | 09:00 | 10:00 | +4.30 |
| 2025-09-16 | 09:05 | 10:05 | +7.70 |
| 2025-09-17 | 09:05 | 10:05 | +6.00 |
| 2025-09-18 | 09:05 | 10:05 | +1.80 |
| 2025-09-19 | 09:10 | 10:10 | +6.50 |
How trading costs change a backtest result: a worked EUR/USD example
Second block: publish the losses too
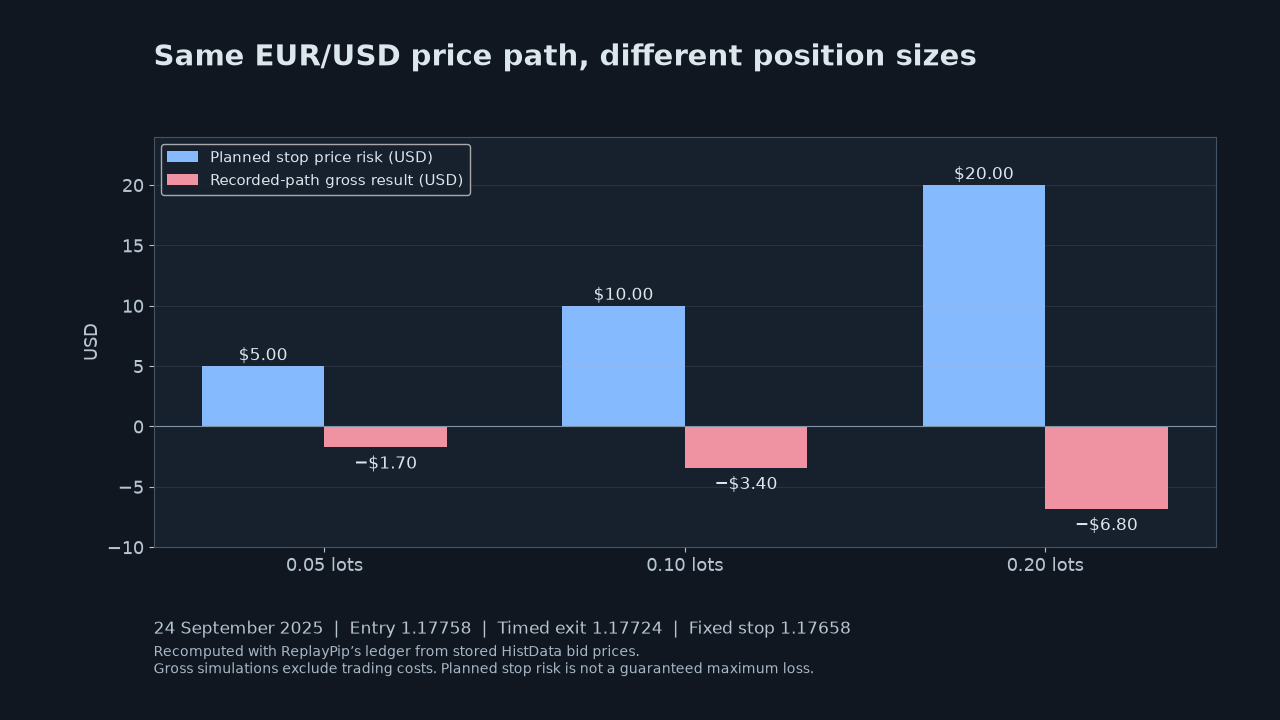
The next block produced +10.80, +16.50, −3.40, +7.00 and −0.40 USD: +30.50 USD gross. The 24 September loss was then reproduced in the local interface and captured for the companion article. Its entry 1.17758 and timed exit 1.17724 matched the engine calculation.
Across both blocks, eight trades gained and two lost, for +56.80 USD gross. Subtracting ten invented 5.20 USD cost allowances leaves +4.80 USD. Neither 80% observed winners nor this small adjusted total is a dependable estimate of future performance. The same data used to choose a teaching example cannot simultaneously be described as unseen validation.
| UTC date | Entry label | Exit label | Gross USD |
|---|---|---|---|
| 2025-09-22 | 09:00 | 10:00 | +10.80 |
| 2025-09-23 | 09:15 | 10:15 | +16.50 |
| 2025-09-24 | 09:15 | 10:15 | −3.40 |
| 2025-09-25 | 09:00 | 10:00 | +7.00 |
| 2025-09-26 | 09:00 | 10:00 | −0.40 |
Save the decisions, not just the total
The CSV includes date, dataset basis, entry and exit labels, original stop and target, size, initial price risk, gross result, R and exit reason. It also includes the illustrative cost allowance and adjusted result in separate columns. Dates are ISO UTC labels and numbers use decimal points; translate column headings in your own spreadsheet if needed.
The source repository retains the two protocols, the 125 five-minute observations for each block and a verification script using the same ledger as the UI. These support reproducibility of this application exercise, not an independent certification of market prices. The CSV has no private user trades or broker credentials.
Design a stronger next exercise
Choose the next dates, rule version, missing-data policy and stopping point before examining outcomes. Keep both rejected and accepted opportunities. Separate development data from later evaluation data; do not keep changing filters on the same ten rows until the result looks attractive.
If you change the stop or entry condition, start a new version and retain A1. Choose a sample for the question you want to answer rather than treating ten sessions as a universal minimum. A recorded simulation tests process and assumptions; live liquidity, costs, risk and behaviour remain different. No win rate or profit target is promised here.