RECORDED LOSING REPLAY
A losing EUR/USD replay: what the journal actually revealed
A loss is useful evidence only when you can reconstruct the decision. On 7 November 2026 we reproduced a EUR/USD replay from 24 September 2025 in the local ReplayPip interface and checked it with the application’s trading engine. The long lost 3.40 USD before costs. This article explains the unchanged plan, the recorded exit and what this single example cannot tell us about a trading strategy.
How this losing example was selected
This is a retrospective teaching example, not a randomly selected or untouched test. We first ran the same exercise over 15–19 September 2025 and obtained five gross gains. We then examined 22–26 September with unchanged rules and selected the first losing session in that second batch: 24 September. The downloaded journal retains all ten dates, including the gains and the other loss. The earlier published 17 September example was already known before this exercise.
Choosing a losing example after seeing a batch is selection too. We disclose that choice rather than describing this trade as evidence of a typical loss, an emotional mistake or the strategy’s expected performance. We did not observe a real trader’s feelings. The lesson is about keeping a decision record when an outcome is disappointing.
Testing one setup across ten replay sessions: keep the whole journal
The plan that stayed fixed
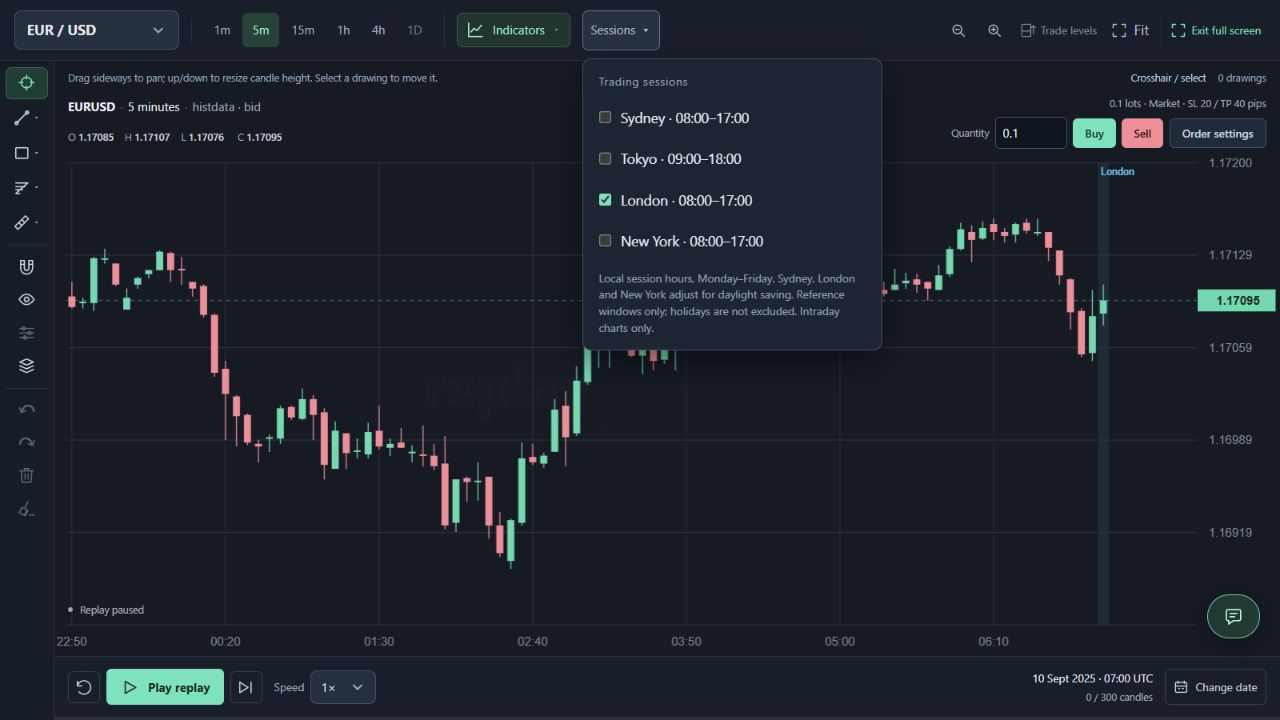
Use EUR/USD five-minute candles, HistData bid, starting at 09:00 UTC. Enter one long at the first revealed candle with close greater than open, up to and including the 10:00 label. If none qualifies, record a skip. Use 0.10 lots, a 10-pip stop and a 20-pip target. Do not move either level or add a second trade. If neither level closes the trade, exit after 12 subsequent five-minute candles.
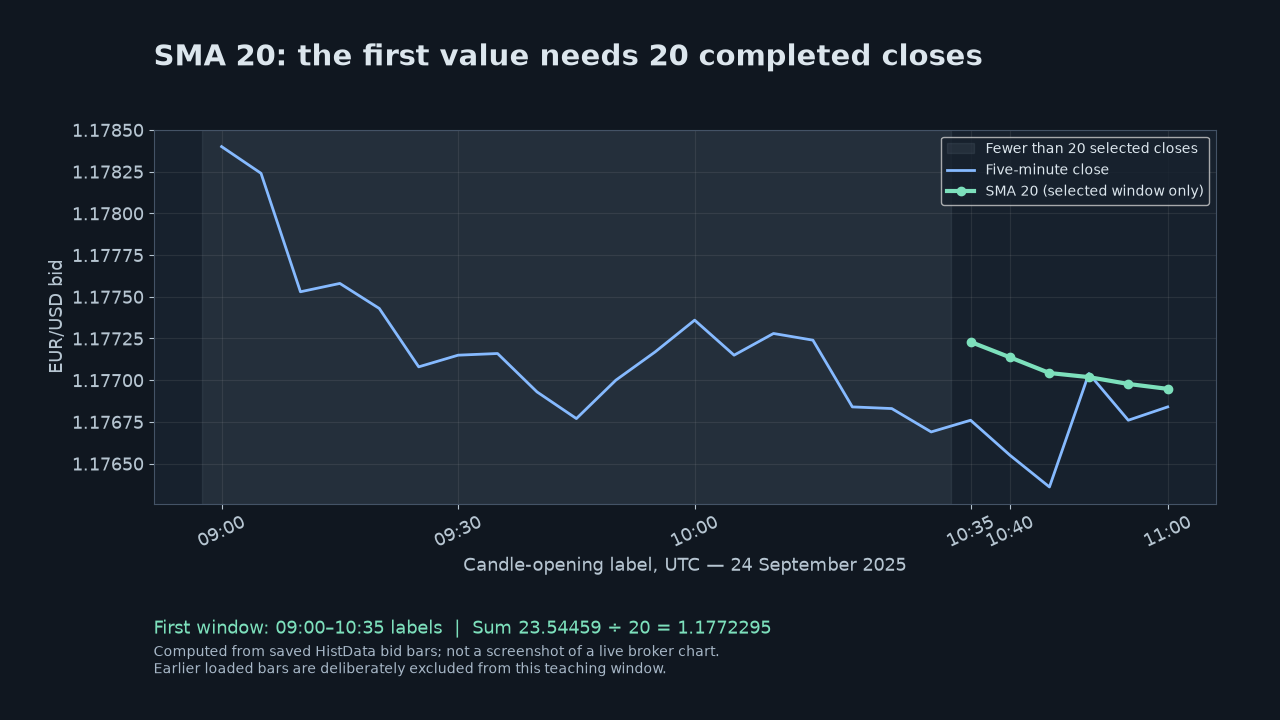
The rule is deliberately simple and has no demonstrated edge. SMA 20 is visible in the capture, but it is not an entry filter. A candle timestamp labels its opening: using the close of the candle labelled 09:15 means using the completed 09:15–09:20 interval, not knowing that close at 09:15 in real time.
The entry and planned risk
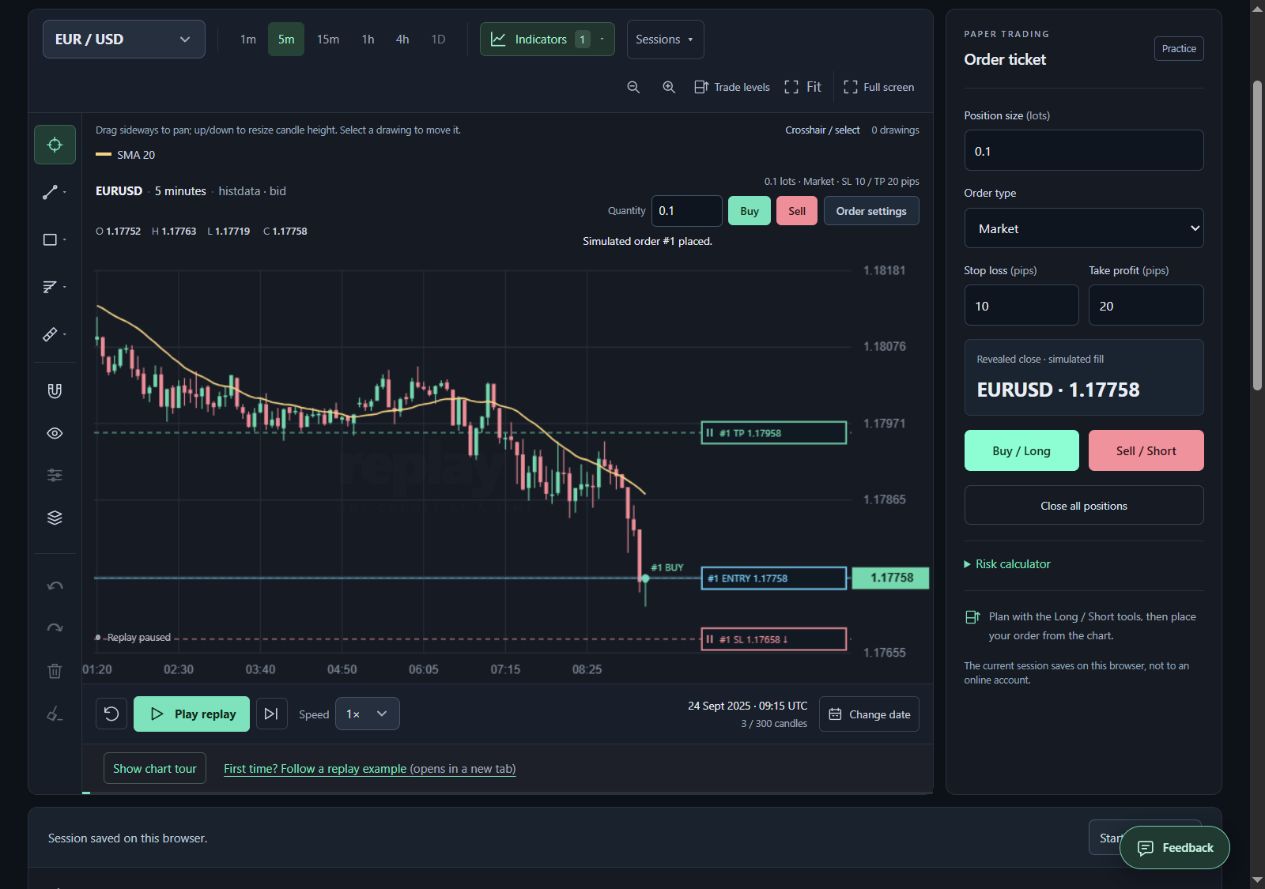
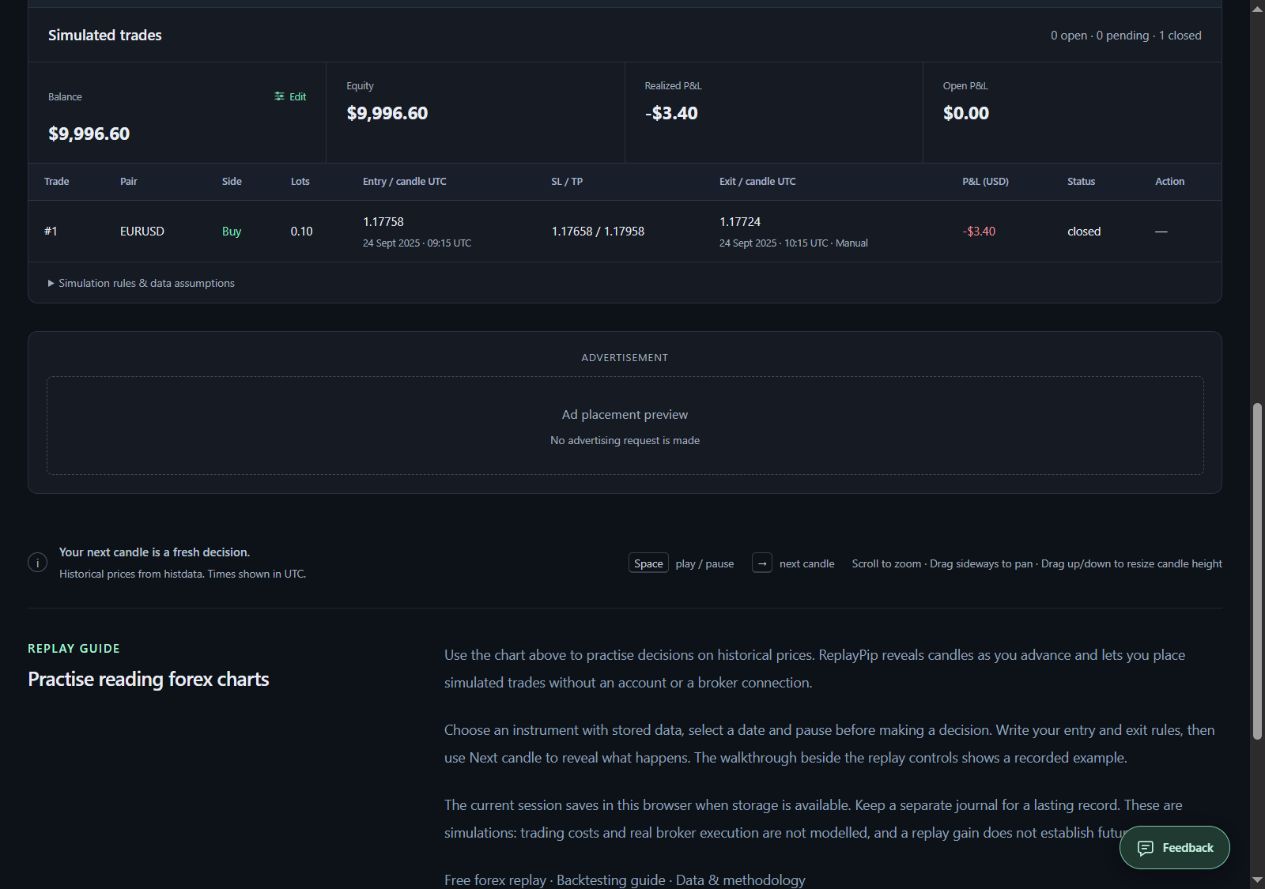
The first qualifying candle was labelled 09:15: open 1.17752, high 1.17763, low 1.17719 and close 1.17758. The preceding three candles did not meet the entry condition. Buying at the revealed close produced entry 1.17758, stop 1.17658 and target 1.17958.
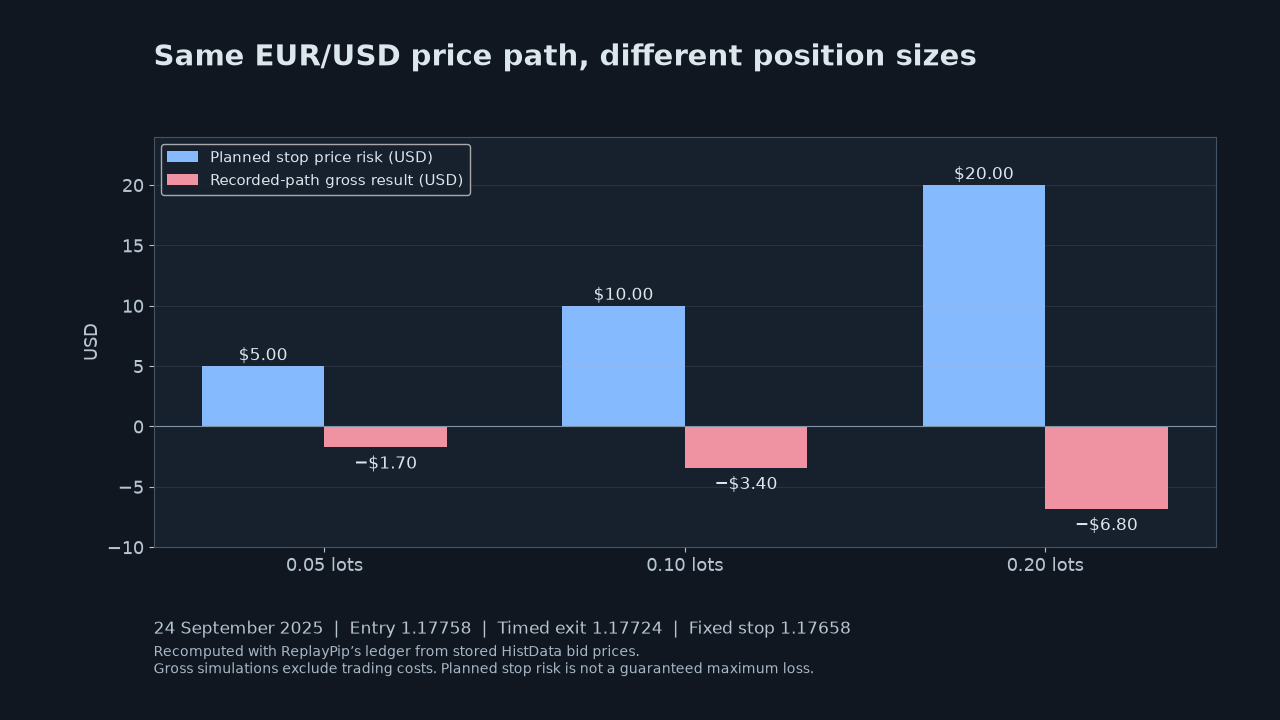
For this EUR/USD simulation, 0.10 lots represents 10,000 base units. Initial price risk was (1.17758 − 1.17658) × 10,000 = 10 USD. That is 0.1% of the 10,000 USD starting balance before costs or gaps. This is an example calculation, not a recommended risk percentage or a guaranteed loss limit.
The timed exit, without rewriting the rule
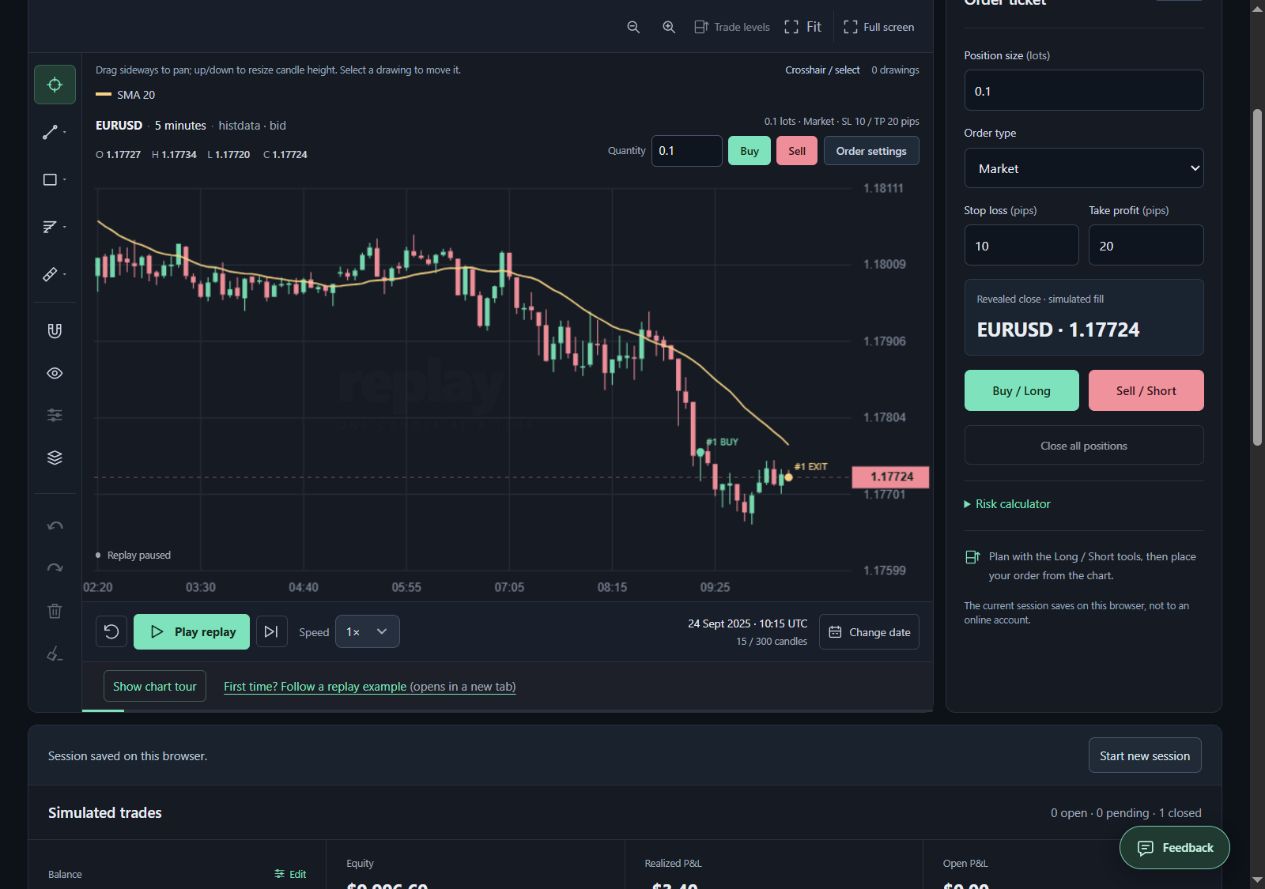
Neither stop nor target closed the position during the next 12 candles. At the candle labelled 10:15 UTC, the revealed close was 1.17724. We used Close all positions and the ledger recorded a Manual exit. The gross result was (1.17724 − 1.17758) × 10,000 = −3.40 USD: −3.4 pips, or −0.34R against the initial 10 USD price risk.
The ending balance was 9,996.60 USD. The stop was not hit; the time rule closed a smaller loss. Extending the hold after seeing the loss would be a different experiment. The screenshots record the completed local run, and the saved source bars reproduce its entry and exit in the same simulation engine.
What the journal supports—and what it does not
The journal supports a narrow conclusion: this particular run followed the specified entry, fixed levels, one-trade limit and timed exit, and still lost money. A loss does not by itself prove a rule was broken; a gain does not prove the process was sound. The entry rationale—a bullish candle alone—is weak evidence for buying, irrespective of this result.
Record planned versus actual entry, original levels, exit reason, costs and any deviation. Keep a proposed change in a separate column. Do not retroactively widen the stop or relabel a valid loss as a trade you would have skipped. Test a changed rule on another declared sample, and keep the original result visible.
Costs, limitations and a reproducible next step
The −3.40 USD is a gross simulated result. ReplayPip excludes spread, commission, slippage and financing. Under the separate invented 5.20 USD cost scenario in our trading-cost article, the arithmetic result becomes −8.60 USD. That subtraction is not a reconstruction of bid/ask fills or whether costs would have changed a trigger.
Download the ten-session CSV and the written protocol, then reproduce the 24 September session before interpreting it. The screenshots, stored-data calculations and ledger agree for this run; they do not independently authenticate the provider’s prices. Dataset revisions can change later replays. One selected loss and ten retrospective sessions cannot establish expected returns, personal trading experience or future profitability.
How trading costs change a backtest result: a worked EUR/USD example