BACKTESTING WORKSHOP
Stop loss and take profit in the same candle: what a backtest can know
A candle can touch your stop and target without telling you which came first. Choosing the winning exit after seeing the chart creates a result the data cannot justify. This workshop uses a deliberately constructed EUR/USD example to separate the prices a candle records from the sequence it leaves unknown. It then shows how to document that uncertainty in a replay journal.
Start with a position that is already open
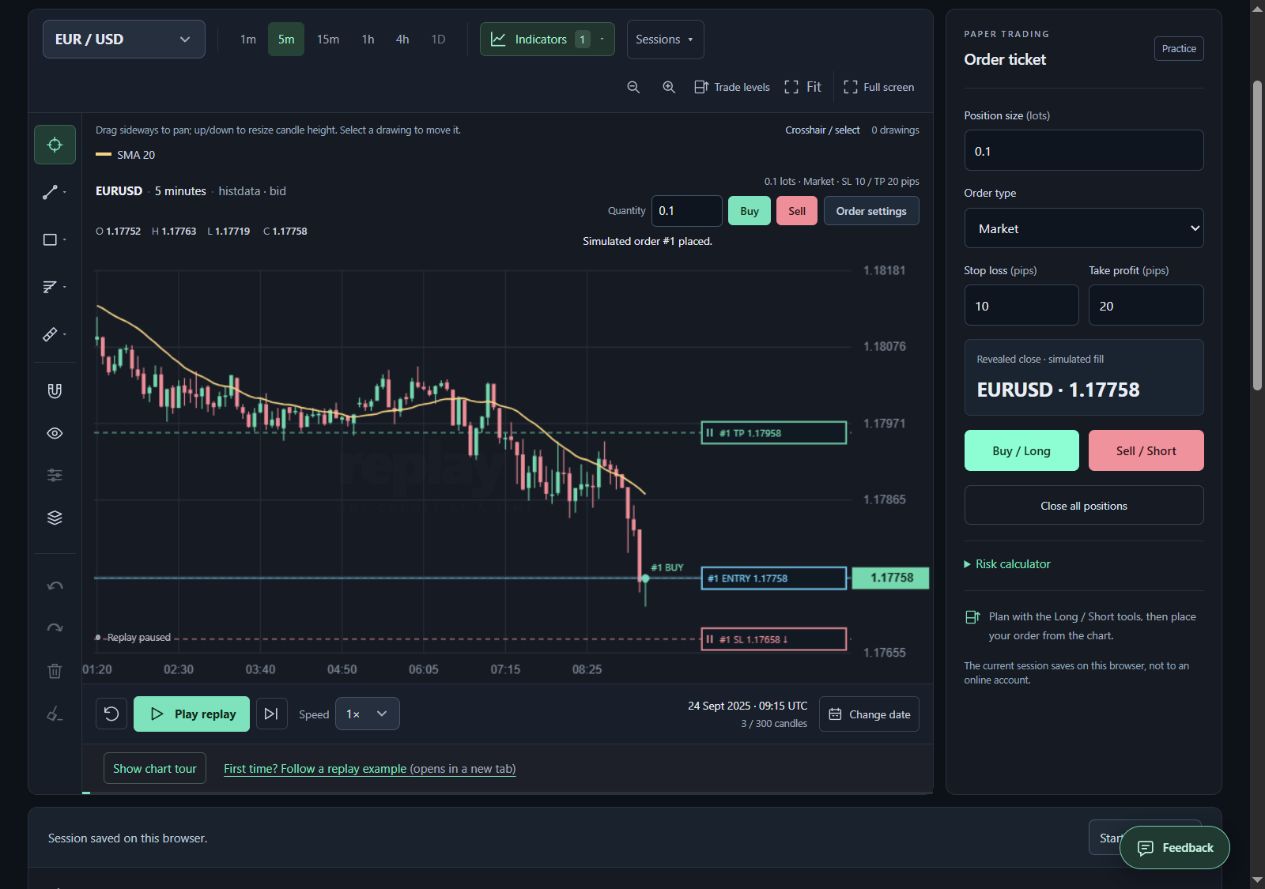
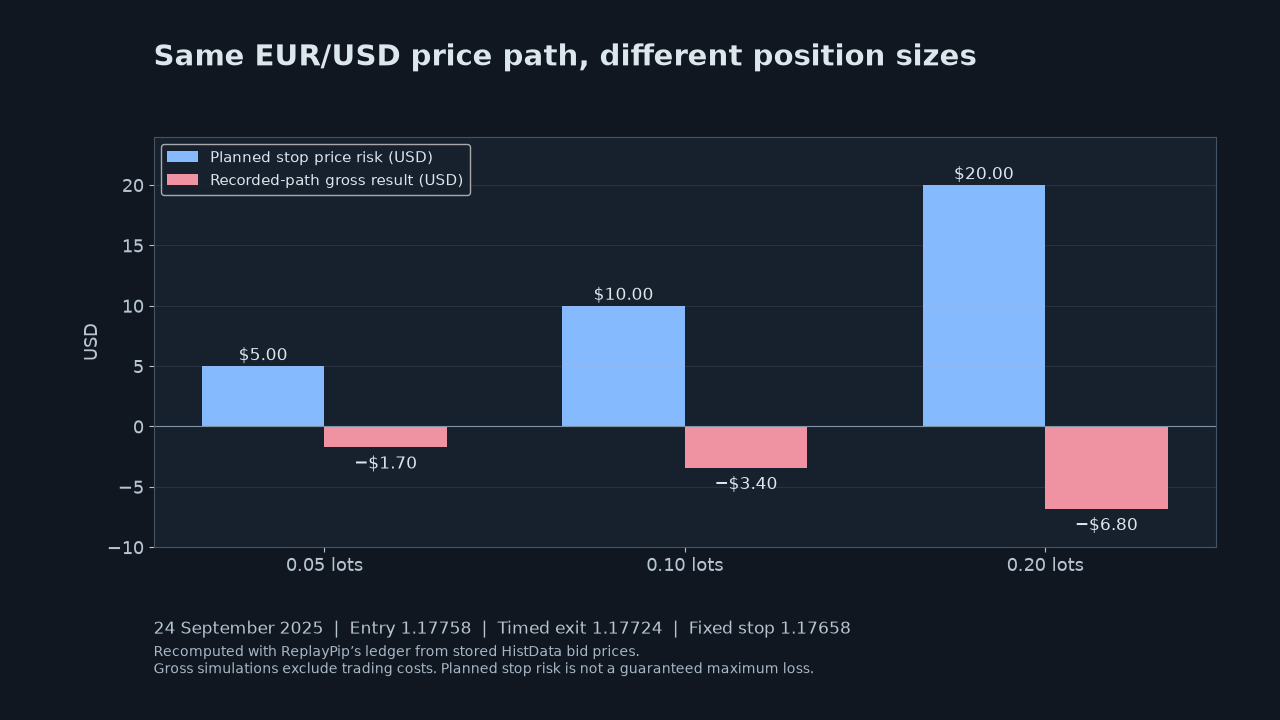
Assume a long is open at 1.10000 before the next candle begins. Use 0.10 lots, a stop at 1.09900 and a target at 1.10200. Under ReplayPip’s EUR/USD contract convention this represents 10,000 base units: initial price risk is 10 USD and the target gain is 20 USD before costs. Fix these levels before inspecting the next candle.
The next five-minute candle opens at 1.10000, reaches a high of 1.10250 and a low of 1.09850, and closes at 1.10100. Both exit prices fall inside its range. The bullish close does not establish that the target was reached before the stop. Candle colour summarises the open-to-close change, not the order of intrabar movements.
Two paths can produce exactly the same OHLC
Path A visits 1.10000, then 1.10250, then 1.09850, and finally 1.10100. Its target is touched first, giving the hypothetical long +20 USD before costs. Path B visits 1.10000, then 1.09850, then 1.10250, and finally 1.10100. Its stop is touched first, giving −10 USD. Both paths have the same open, high, low and close.
That is a 30 USD difference in the outcome of one position, with no difference in the five-minute OHLC record. Neither path is a reconstruction of ticks. They are counterexamples showing why a candle alone cannot settle the question. Counting +20 USD because the candle eventually rallied would quietly add information the dataset does not contain.
| Path | Order of extremes | First exit | Gross USD |
|---|---|---|---|
| A | High then low | TP | +20.00 |
| B | Low then high | SL | −10.00 |
| ReplayPip OHLC policy | Unknown; stop-first convention | SL (both touched) | −10.00 |
What ReplayPip actually records
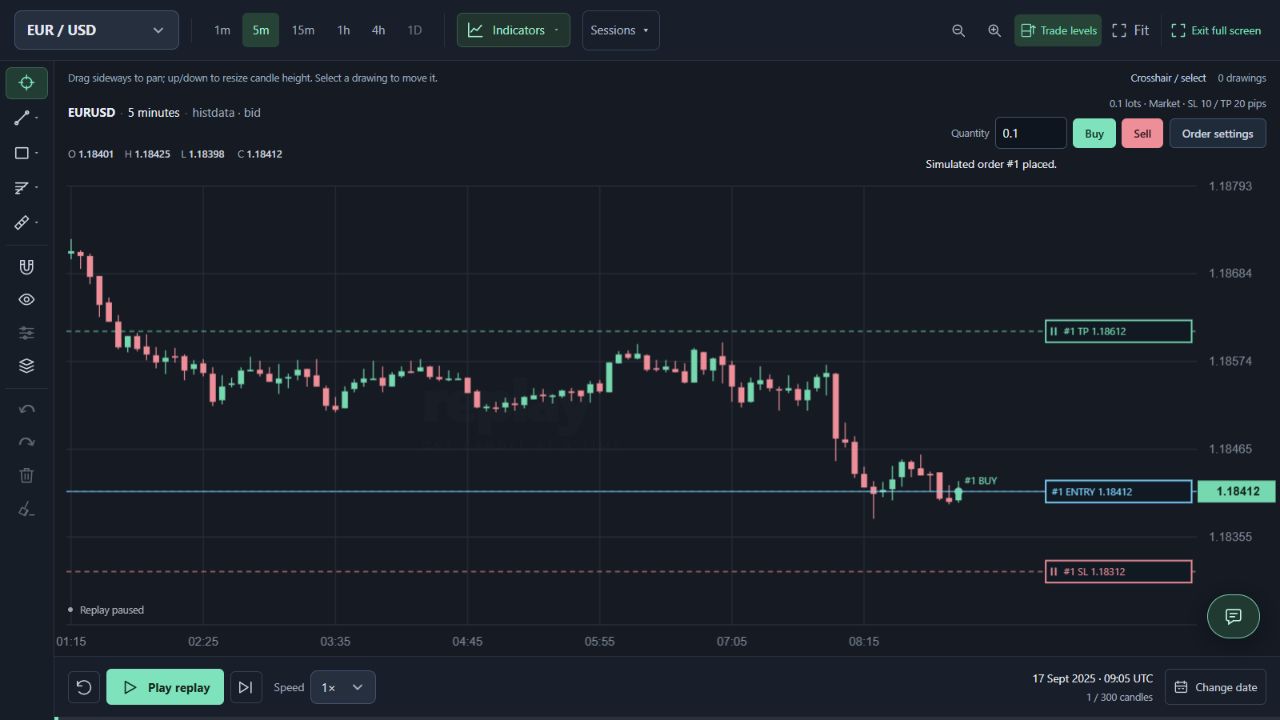
For an already open trade, ReplayPip checks a later candle’s opening gaps first. When the open remains inside the stop and target and that candle subsequently touches both, its OHLC engine applies the stop first and records the reason SL (both touched). In this controlled example the result is −10 USD. This is a defined simulation convention, not a claim that the market took Path B.
A market order entered at the close of a revealed candle does not receive an exit from the earlier high or low of that same candle. The example therefore places the position before the ambiguous candle. Pending orders introduce a separate entry-sequence problem; do not assume this already-open example proves how a pending order would execute in live trading.
When a smaller timeframe helps—and when it does not
If complete one-minute observations from the same feed show the target touched in an earlier minute than the stop, they can resolve the ordering that the five-minute record hides. But if both levels are inside one one-minute bar, the ambiguity remains. Tick data can provide finer sequencing, yet bid/ask coverage, gaps and execution assumptions still need checking.
Switching chart timeframe is a way to inspect available evidence, not permission to replace missing prices or choose the most favourable feed. Compare the same timezone, instrument and price basis. Record which observation resolves the ordering; if none does, retain an ambiguity flag and the declared fill rule rather than guessing a smooth path.
Why missing candles affect your backtest—and how to check them
Keep a sensitivity record, not a rewritten result
In your worksheet retain the official model result of −10 USD, a both-touched flag and the alternative +20 USD as a sensitivity scenario. The alternative is not a second trade or extra profit. If many trades depend on this convention, calculate the sample with a consistent pessimistic rule and a separate optimistic scenario to show how dependent the conclusion is on unknown sequencing.
A large difference between those scenarios is a reason to obtain better data or redesign the test. A small difference does not make the fills realistic. Spread, commission, slippage and financing are still absent from the ReplayPip ledger. An ordinary stop is not a guaranteed monetary loss cap when the market gaps or actual execution differs.
A repeatable review checklist
Before accepting a backtest total, confirm that the order existed before the tested range, note its original risk, and check the candle open before checking extremes. Flag both-touched candles and keep the policy unchanged across wins and losses. Save the timeframe and feed beside the exit reason so another reader can reproduce the calculation.
Use the downloadable controlled example to practise the arithmetic, then inspect your own ambiguous trades without altering their original journal entries. The useful outcome is a traceable distinction between observation and assumption. It is not a prettier equity curve or a prediction that the next live stop will fill at its displayed price.