BACKTESTING WORKSHOP
Trading expectancy: a worked example beyond win rate
A high win rate does not tell you whether a backtest made money. The size of wins, losses and costs matters too. Here is a small, fully specified teaching dataset you can calculate by hand or download. These ten results are invented arithmetic examples, not ReplayPip performance, market observations or evidence of a tradable strategy.
Define the unit before calculating a score
Let 1R mean the initial planned price risk of a trade. In this example every trade risks 10 USD before costs, so +2R means +20 USD and −1R means −10 USD. Keep the original denominator after a stop adjustment. Redefining risk after you know the exit can make two identical outcomes appear to have different R results.
The ordered gross results are +2, −1, −1, +1.5, −1, +2, −1, −1, +1 and −1 R. All ten observations stay in the sample. There are no breakeven trades here; in a real journal include them in the total count and state how you classify a zero result when calculating the win rate.
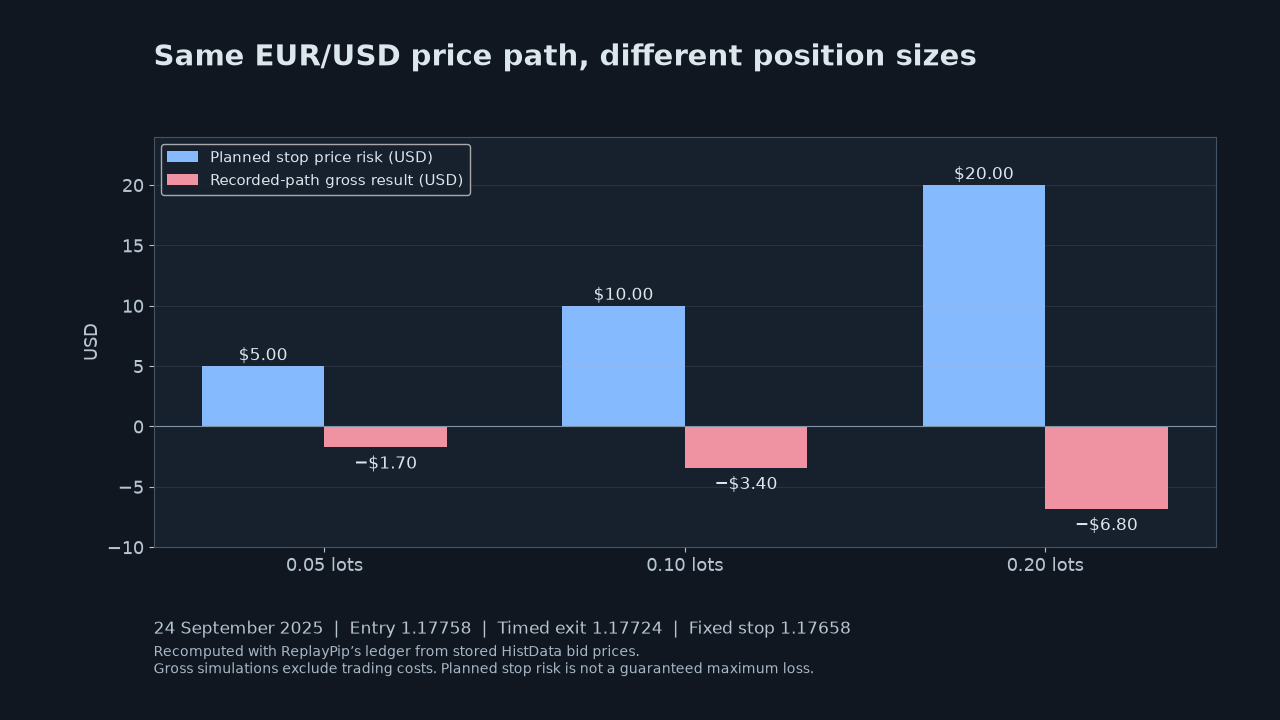
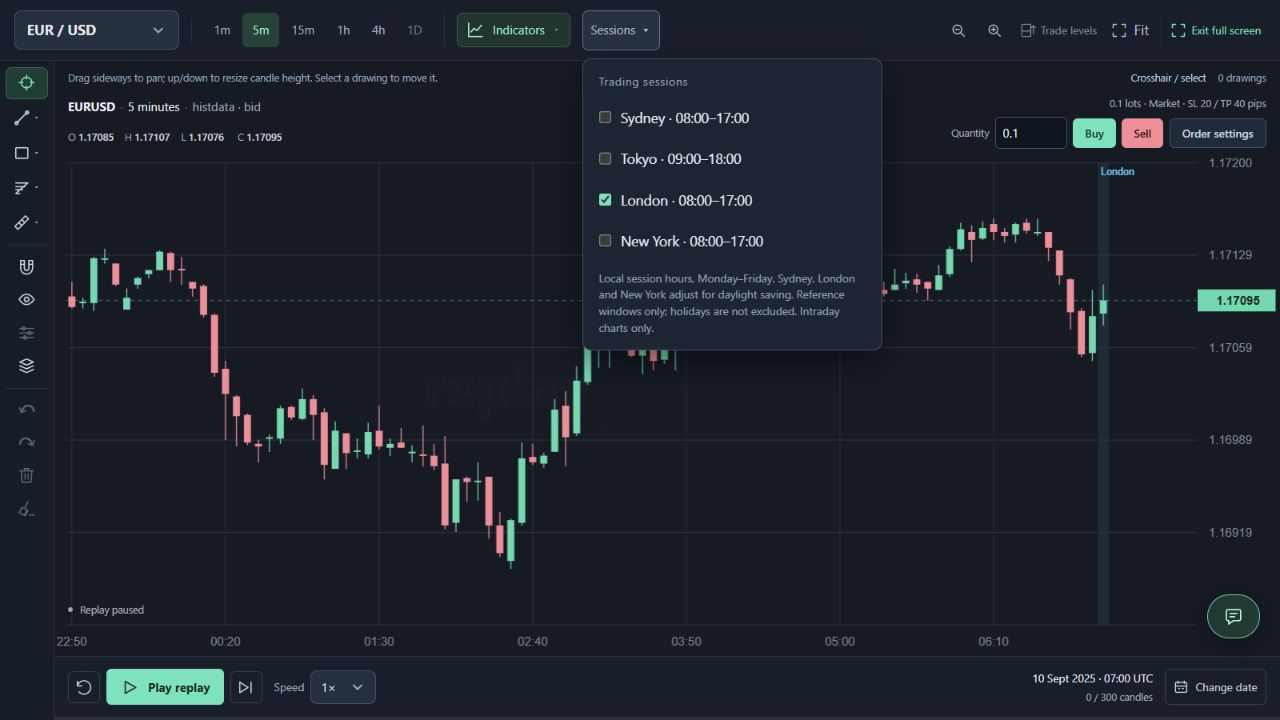
How position size changes trading risk: one EUR/USD replay, three sizes
Calculate the parts, then the average
There are four winners and six losers: win rate is 4 ÷ 10 = 40%. Winners total 6.5R, making the average win 6.5 ÷ 4 = 1.625R. Losses total 6R in absolute value, making the average loss 1R. Estimated gross expectancy is 0.40 × 1.625 − 0.60 × 1 = +0.05R per trade.
The direct cross-check is simpler: all outcomes sum to +0.5R; divide by ten to get +0.05R. At the fixed 10 USD risk this is +0.50 USD per trade and +5 USD for the sample. These are descriptions of the invented sample, not a promise about the mathematical expectation of a future trade.
| Measure | Gross | After 0.10R per execution |
|---|---|---|
| Total R | +0.50R | −0.50R |
| Mean R/trade | +0.05R | −0.05R |
| Total USD (10 USD risk) | +5.00 | −5.00 |
| Profit factor | 1.0833 | 0.9242 |
Subtract a consistent cost assumption
Assume an illustrative all-in cost of 0.10R, or 1 USD, on every trade. Subtract it from winners and losers alike. Total costs are 1R, so the sample’s +0.5R gross becomes −0.5R net: −5 USD overall and −0.05R per trade. A small gross advantage disappears under this particular assumption.
The cost number is invented, not a current broker quote. Actual spreads, commissions, slippage and financing can vary by instrument and time. ReplayPip displays gross simulated results; this worksheet is a separate sensitivity model. Subtracting a flat amount does not reconstruct bid/ask triggers, rejected orders or different exits caused by execution conditions.
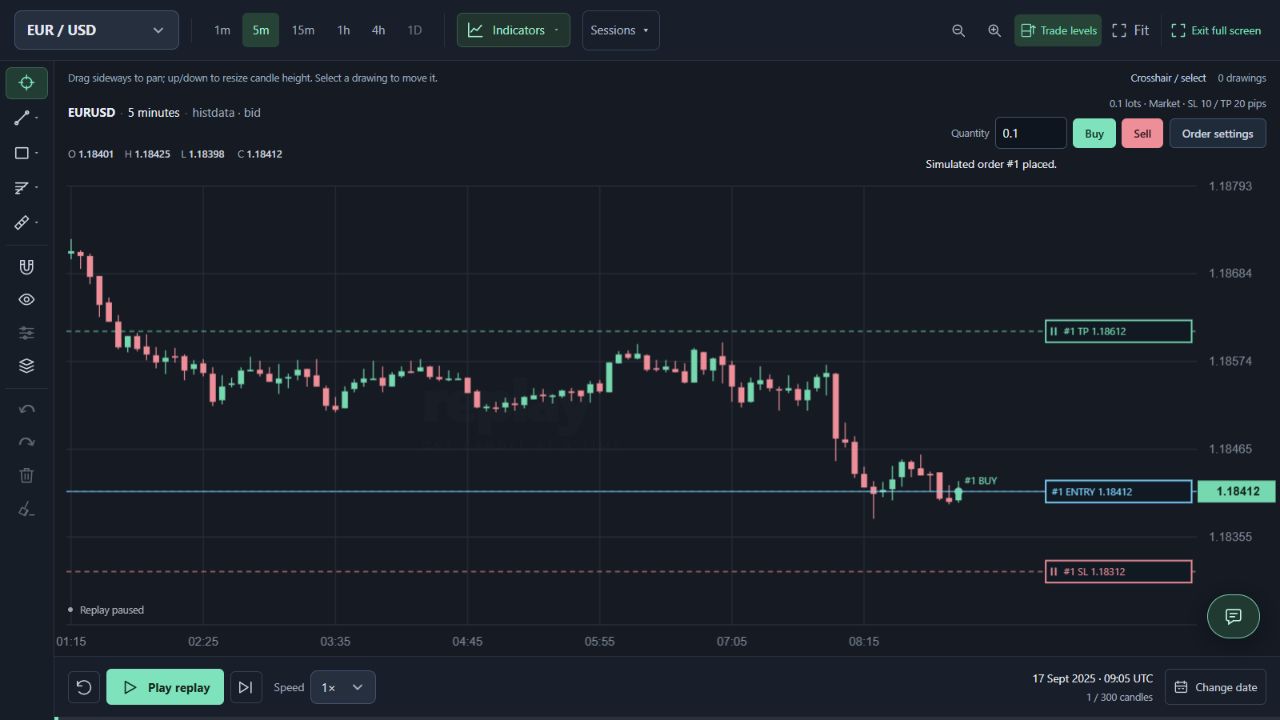
How trading costs change a backtest result: a worked EUR/USD example
Compare profit factor and the losing sequence
Gross profit factor is total positive outcomes divided by the absolute total negative outcomes: 6.5 ÷ 6 ≈ 1.0833. It is not the same as expectancy, and it becomes undefined if there are no losses. After the assumed cost, positive outcomes total 6.1R and negative outcomes total 6.6R, giving a net profit factor of about 0.9242.
For the stated ordering, cumulative gross R is 2, 1, 0, 1.5, 0.5, 2.5, 1.5, 0.5, 1.5 and 0.5. The largest peak-to-later-trough fall in this closed-trade sequence is 2R. This is not intratrade drawdown or a forecast of the next drawdown. Reordering outcomes leaves the average unchanged while changing the path and potential drawdown.
Do not confuse a small sample with a reliable estimate
Remove one +2R observation and the remaining nine total −1.5R; their gross mean becomes about −0.1667R. That does not justify deleting the winner. It shows that this tiny dataset is highly sensitive to individual observations. Report the complete sample first and label any leave-one-out exercise as a sensitivity check.
Real trades may cluster within the same session, trend or news event, so ten entries need not represent ten independent conditions. Compare clearly separated periods and retain unsuccessful periods. No fixed win rate, profit factor or minimum sample size guarantees that a strategy will remain profitable after costs or in another market environment.
Turn the calculation into a useful journal habit
Keep one row per trade with its original planned risk, gross outcome, cost assumption and net R. Calculate expectancy both as the average of all rows and from the win/loss components; disagreements often reveal missing rows, inconsistent denominators or zero-trade classification problems. If position sizes vary, also keep the money results rather than multiplying the mean R by one assumed risk amount.
The download includes every synthetic outcome and a running gross total so you can inspect the arithmetic. Use it as a worksheet template, then replace the examples with your own documented replay observations. A useful report states sample dates, costs, rule version and limitations beside its headline average, instead of presenting one favourable percentage in isolation.