POSITION SIZE WORKSHEET
How position size changes trading risk: one EUR/USD replay, three sizes
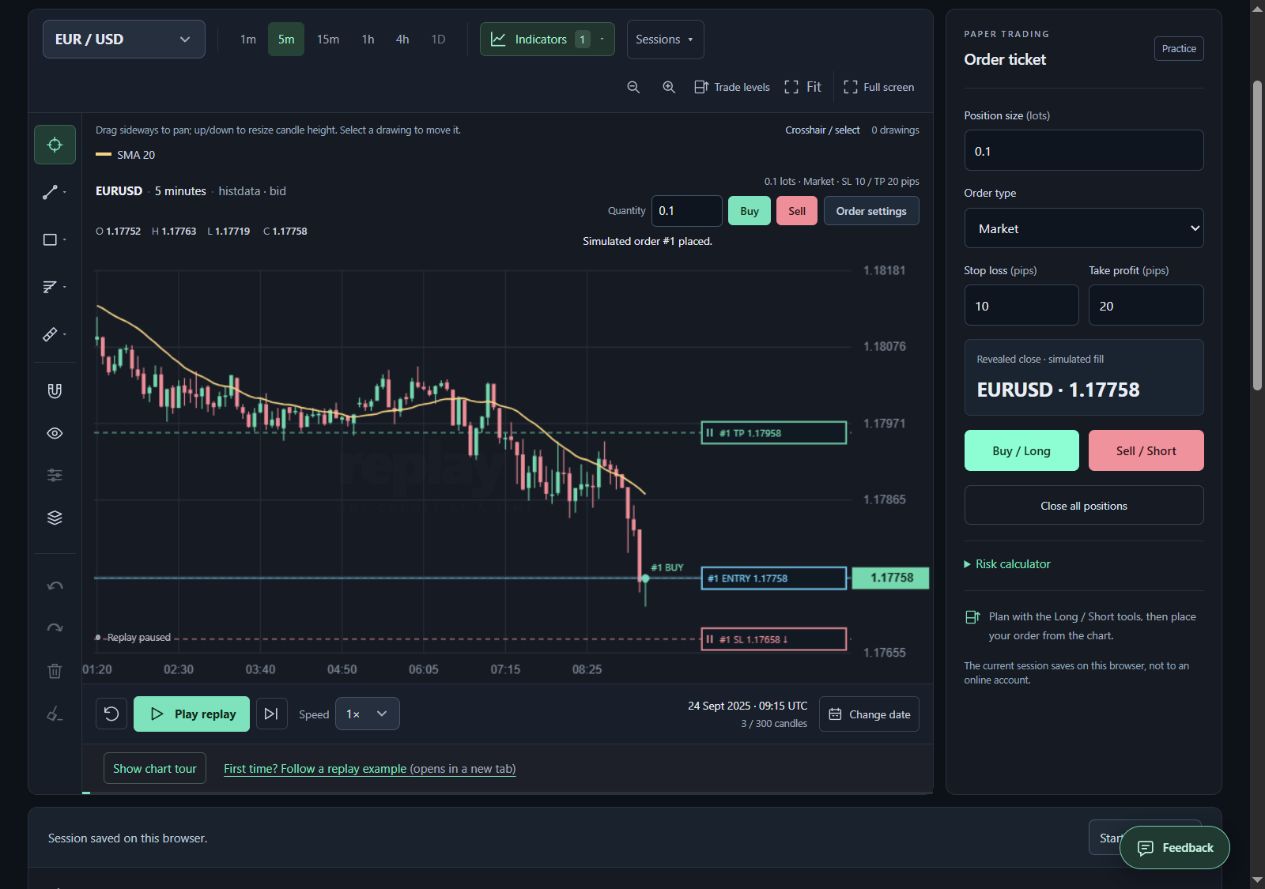
The chart can be identical while the money at risk changes. We took the saved EUR/USD replay from 24 September 2025 and recalculated its unchanged entry, stop, target and timed exit with three position sizes using ReplayPip’s trade ledger. This is a sizing exercise on one selected historical path, not three independent trades or a recommendation about how much to risk.
Keep the price path fixed before comparing money
The recorded long entered at 1.17758 on the candle labelled 09:15 UTC and exited manually at 1.17724 on the 10:15 candle. The original stop stayed at 1.17658 and the target at 1.17958. Neither level closed the trade during the twelve subsequent five-minute candles. A candle label is its opening time: these closes became knowable at 09:20 and 10:20 respectively.
We reused the exact stored bars and the same ledger code for 0.05, 0.10 and 0.20 lots. Entry and exit were not moved to make a size look safer. The original case was selected after inspecting a second five-day batch; this article inherits that selection and does not turn it into an unseen strategy test.
Convert lots into units and planned stop risk
In this EUR/USD example, one standard lot is 100,000 EUR. Therefore 0.05 lots represents 5,000 EUR, 0.10 represents 10,000 EUR and 0.20 represents 20,000 EUR. Because USD is the quote currency and the simulated account currency, multiplying the price movement by those base units gives USD profit or loss without a further currency conversion.
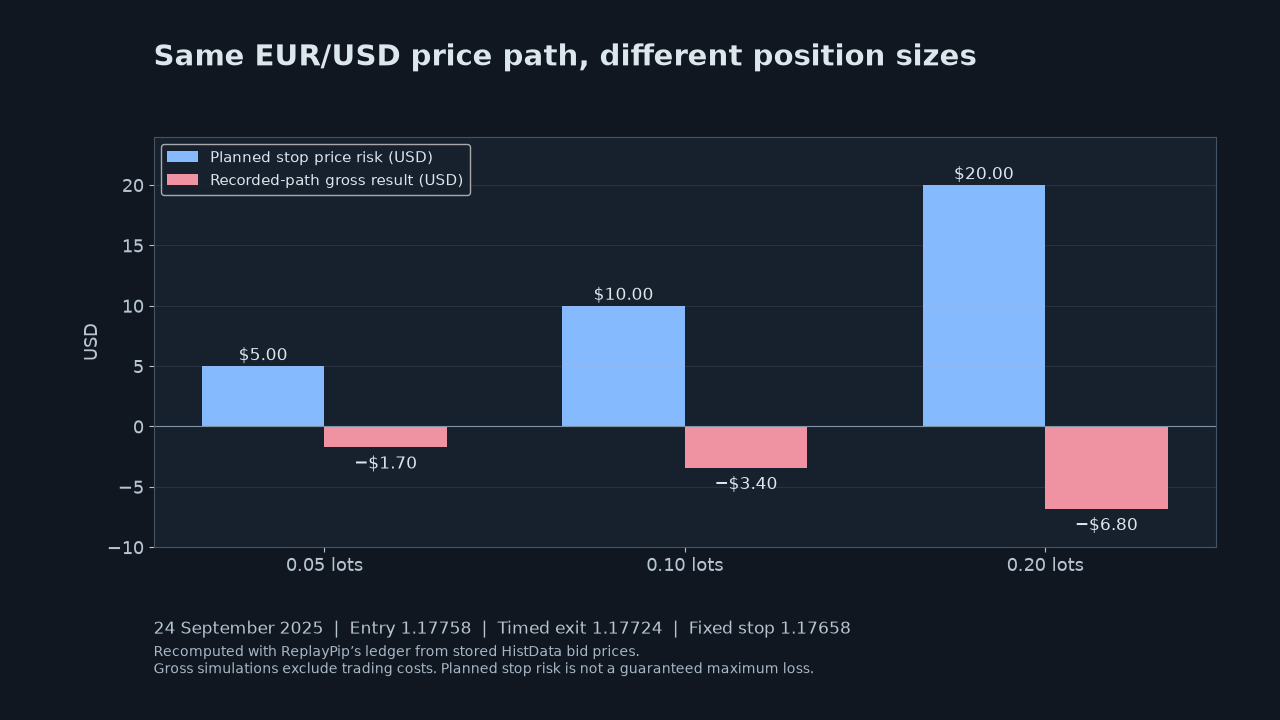
The entry-to-stop distance is 1.17758 − 1.17658 = 0.00100, or ten EUR/USD pips. Planned price risk is distance × base units: 5, 10 and 20 USD. This calculation excludes costs and gaps. Do not copy the EUR/USD pip value to USD/JPY, metals or contracts with different specifications; first check the instrument, quote currency and account currency.
Calculate the actual outcome separately
The timed exit moved against the long by 1.17724 − 1.17758 = −0.00034, or −3.4 pips. Multiplying by 5,000, 10,000 and 20,000 units produces −1.70, −3.40 and −6.80 USD before costs. We verified each result with the ledger instead of merely changing the displayed balance.
The loss is smaller than planned stop risk because the time rule closed the position before the stop was reached. The table keeps these quantities in separate columns. Calling the 10 USD planned risk the actual loss would misdescribe this run; calling the 3.40 USD actual loss the maximum possible risk would also be wrong.
| Lots | Base units (EUR) | Planned stop risk USD | Gross result USD | Result R |
|---|---|---|---|---|
| 0.05 | 5,000 | 5.00 | −1.70 | −0.34 |
| 0.10 | 10,000 | 10.00 | −3.40 | −0.34 |
| 0.20 | 20,000 | 20.00 | −6.80 | −0.34 |
Use R to compare the same outcome fairly
Define one R here as the original planned price risk before costs. Dividing each gross result by its own initial risk gives −0.34R: −1.70 ÷ 5, −3.40 ÷ 10 and −6.80 ÷ 20. Doubling the size doubles the dollar exposure; it does not improve this entry or its result measured in R.
The repeated −0.34R values are one path scaled three ways, not a sample of three observations. Costs may scale differently because of minimum commissions or execution conditions. We have not assumed a particular broker tariff, financing charge or liquidity model, so these gross figures should not be presented as executable net outcomes.
How trading costs change a backtest result: a worked EUR/USD example
Work backwards from an illustrative budget
For a 10,000 USD simulated balance, an illustrative 0.1% price-risk budget is 10 USD. Dividing 10 by the 0.00100 stop distance gives 10,000 base units, or 0.10 lots. We checked the same inputs against ReplayPip’s risk-size function. This percentage illustrates the arithmetic; it is not a suggested personal risk setting.
A size must also satisfy the instrument’s minimum, maximum and increment. Rounding up can exceed a budget. Rounding down may leave some budget unused, and a size below the minimum may mean the planned trade cannot fit that budget. Check the rounded units and recalculate price risk instead of treating the input percentage as a guaranteed fill outcome.
Keep a record that survives a disappointing result
Download the three-row comparison and reproduce the multiplication. Record entry, original stop, size, initial price risk, exit reason, gross result and costs separately in your own journal. If you change the stop distance as well as size, you are testing another plan and should label it as a new version.
This calculation demonstrates exposure, not profitability. A stop can fill differently after a gap, and a bid-only candle simulation does not reproduce a broker’s bid/ask execution. The saved dataset revision and verification script make our arithmetic repeatable; they do not independently certify the provider’s prices or guarantee a future loss limit.