RECORDED REPLAY CASE STUDY
EUR/USD replay case study: a recorded trade from plan to exit
What does following a written replay plan actually look like? On 27 October 2026 we ran one local ReplayPip session using stored EUR/USD prices from 17 September 2025. We wrote the entry and exit rules before loading that date, kept the first result and recorded the screenshots below. The trade gained 6 USD in simulation before costs. This is a demonstration of the workflow, not evidence that the entry rule is profitable.
The date, dataset and clock used
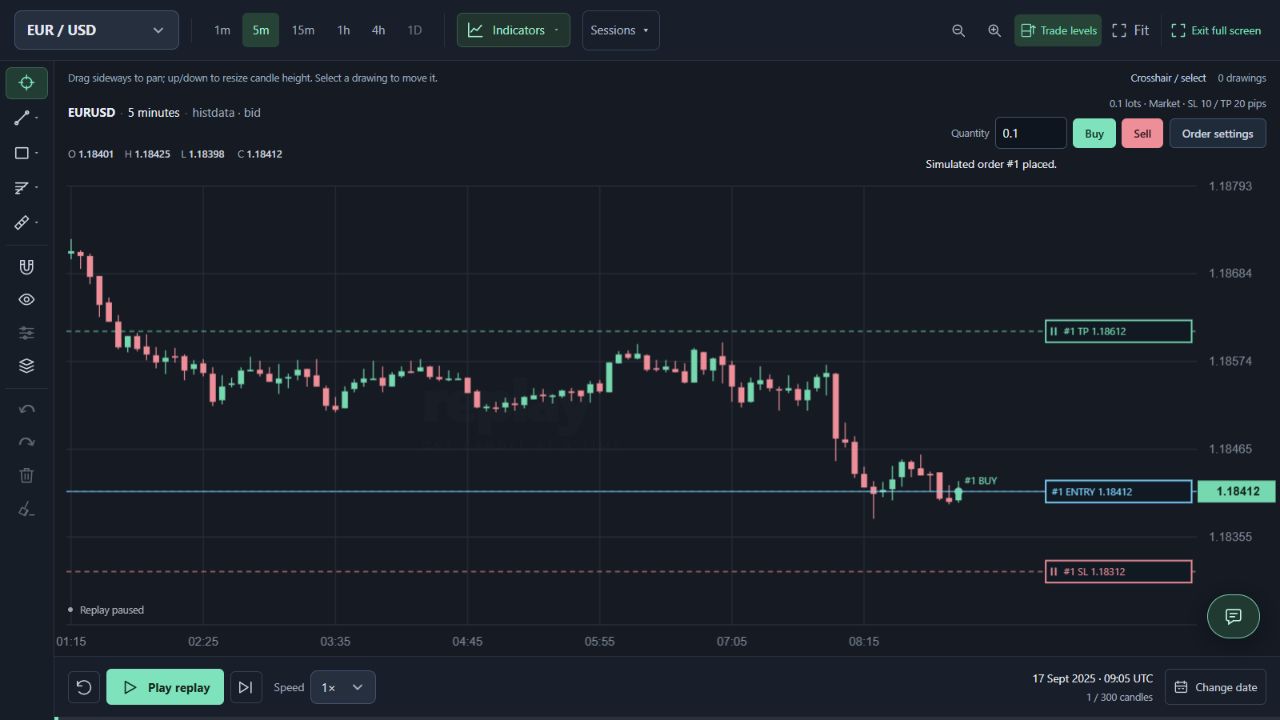
To reproduce the run, choose EUR/USD, five-minute candles and 17 September 2025 at 09:00 UTC, with HistData bid data. The session started with a simulated 10,000 USD balance and no trades. We used an existing local import, not a live broker connection or generated sample prices. The selected date was kept after seeing the result; we did not search for a better-looking replacement.
Replay timestamps label the opening of each candle. The simulator reveals the whole candle, then a market order uses its close. An entry recorded against 09:05 therefore uses the close of the 09:05–09:10 five-minute candle; it does not imply that this close was known at 09:05 in real time. Different feeds or later data revisions can produce different prices.
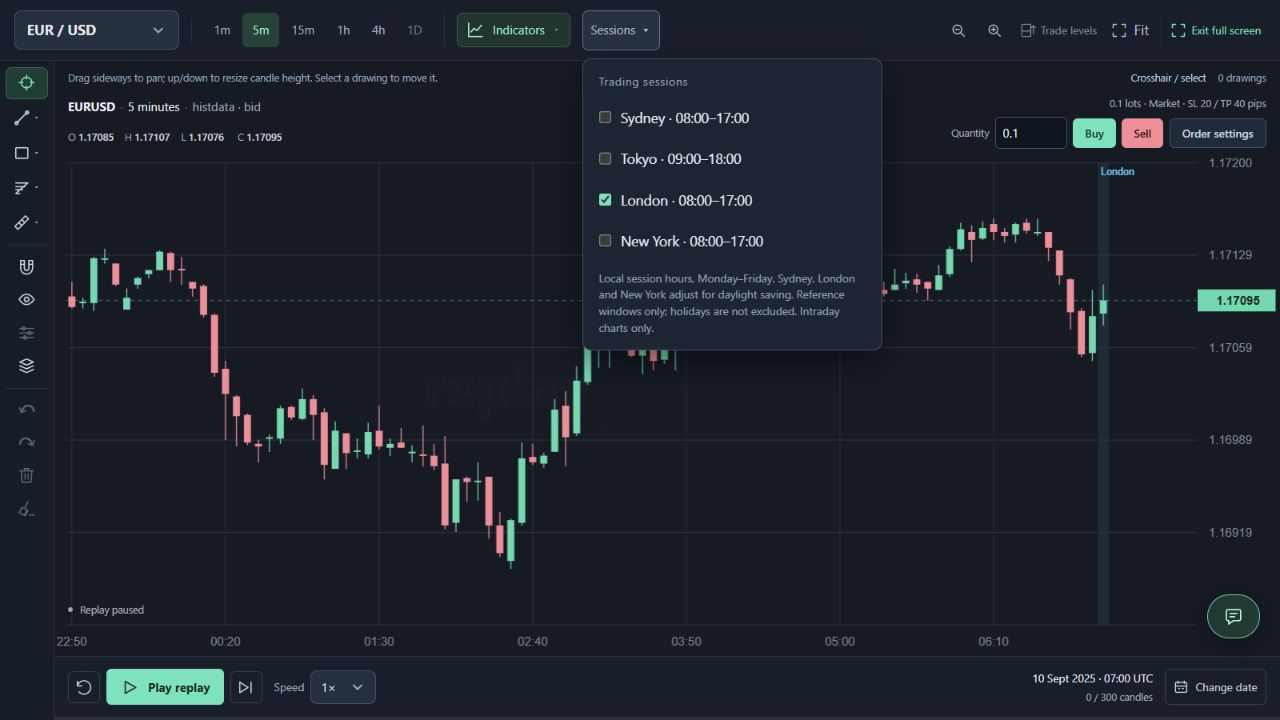
Practise a defined time window with the London session backtesting: a manual EUR/USD replay exercise.
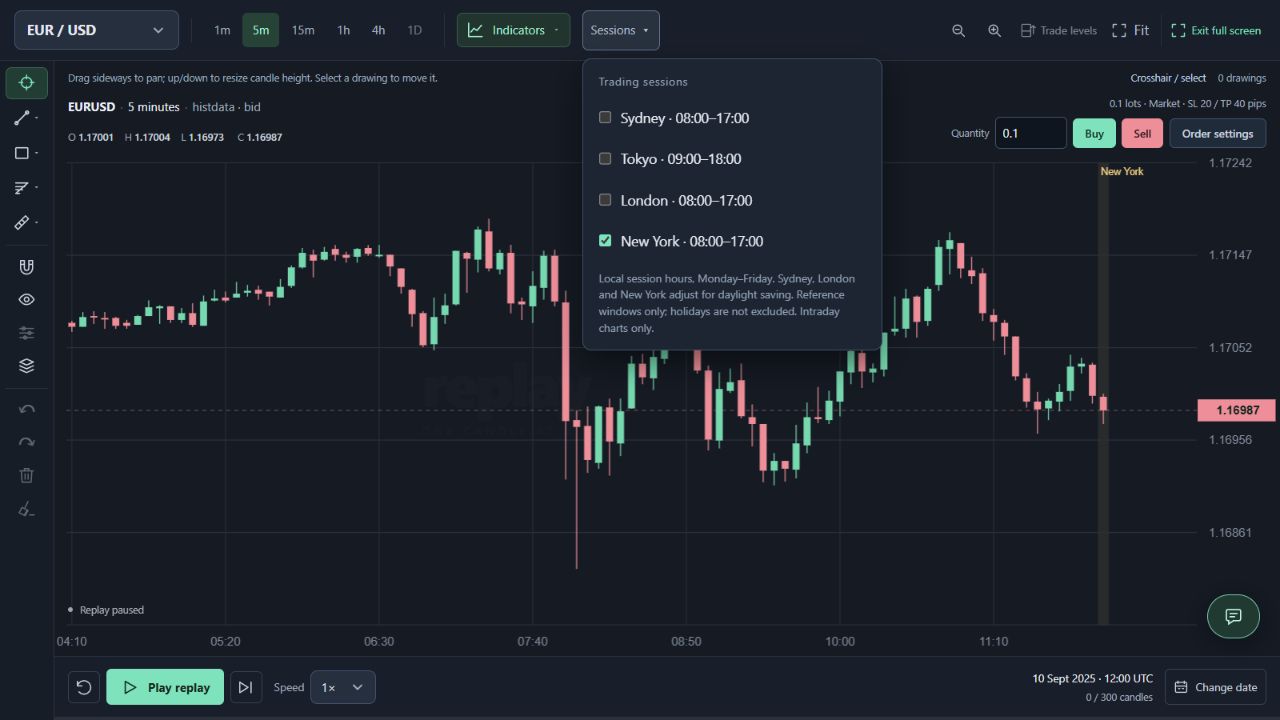
Practise a defined time window with the New York session backtesting: replay a EUR/USD trade plan.
The rules written before advancing
Enter one simulated long at the first revealed bullish close, defined as close greater than open, starting with the candle labelled 09:00. If none appears by 10:00 UTC, skip the trade. Use a fixed 0.10 lots, a 10-pip stop and a 20-pip target. Do not move the levels, add another trade or change the rule after seeing the outcome.
If neither level closes the position, close it manually after 12 subsequent five-minute candles. This is a deliberately simple control exercise. It has no trend filter, news filter or demonstrated trading edge. Its purpose is to make the decisions reproducible, not to recommend buying every bullish candle.
Why the entry was 1.18412
The 09:00 candle opened at 1.18404 and closed at 1.18399, so it did not qualify. We advanced once. The 09:05 candle opened at 1.18401 and closed at 1.18412, so it met the written condition. Buy / Long created order #1 at that revealed close, using 0.10 lots.
The fixed distances gave SL 1.18312 and TP 1.18612. For EUR/USD, 0.10 lots represents 10,000 base units. Initial price risk was 10,000 × (1.18412 − 1.18312) = 10 USD, or 0.1% of the simulated 10,000 USD balance before costs and gaps. The planned target distance was twice the stop distance. That ratio says nothing about how often either level will be reached.
What happened over the next 12 candles
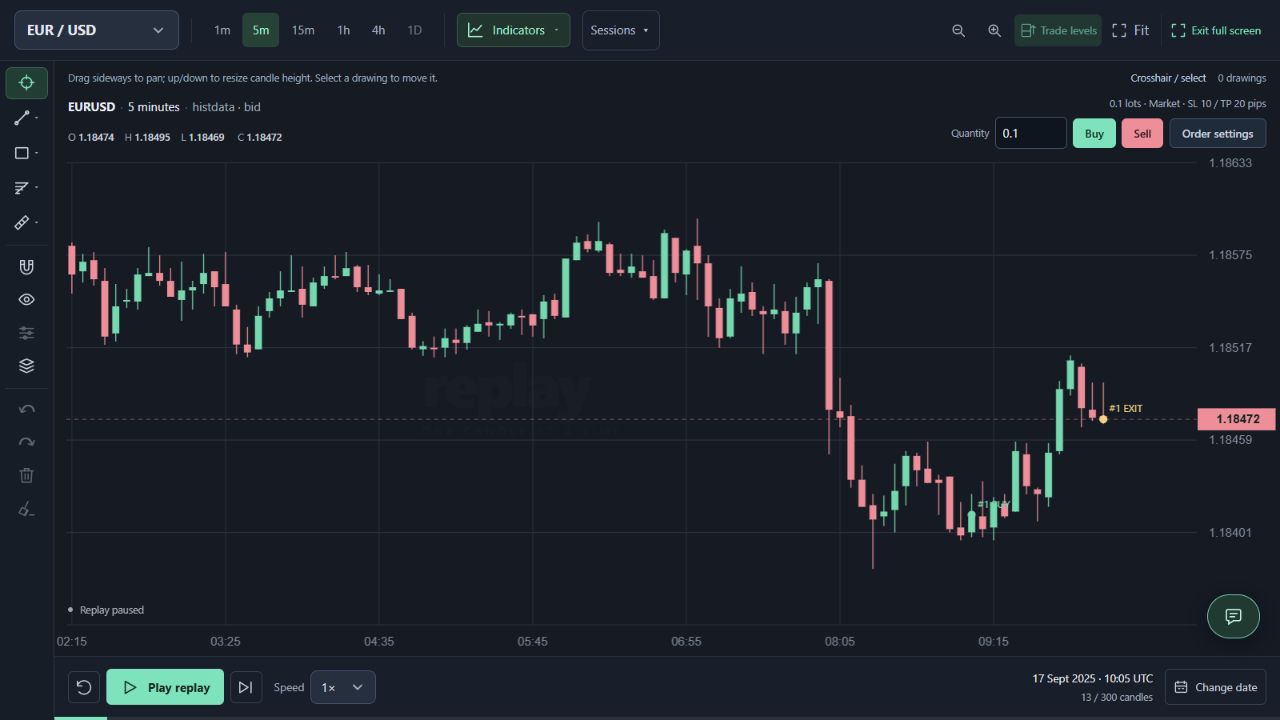
We advanced one candle at a time without changing the order. At the candle labelled 09:10, the close was 1.18403 and the open result was −0.90 USD. At 09:50, the close was 1.18509 and the open result was +9.70 USD. These observations were not reasons to change the exit rule.
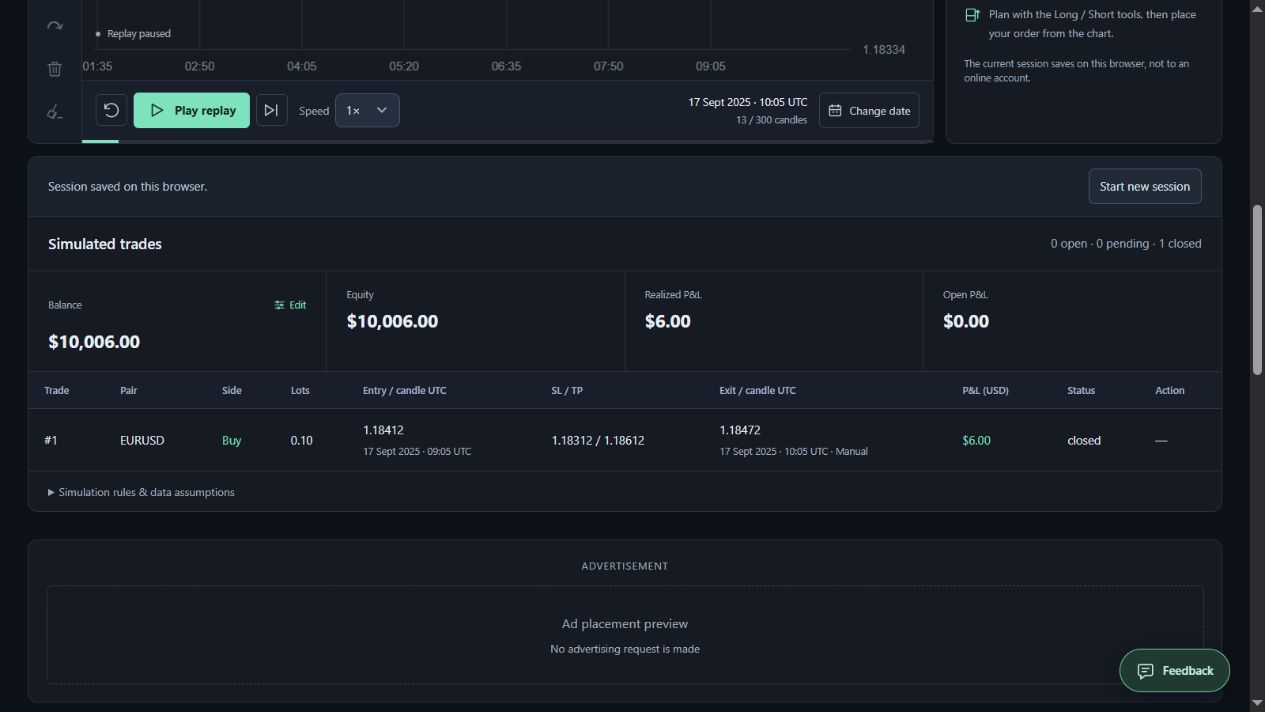
Neither the stop nor target was touched during the 12 subsequent candles. At the candle labelled 10:05, the close was 1.18472. We used Close all positions, as planned, and the table recorded a Manual exit. The screenshots show the ending chart and the completed ledger; they are captures of this run, not illustrations of an invented outcome.
The result and the review
Recorded trade: Buy 0.10 lots; entry 1.18412 at candle 09:05 UTC; initial SL 1.18312; initial TP 1.18612; manual exit 1.18472 at candle 10:05 UTC. Result: (1.18472 − 1.18412) × 10,000 = +6.00 USD, or +6 pips and +0.6R against the initial 10 USD price risk. The simulator balance ended at 10,006 USD. The 20-pip target was not reached.
The entry condition, fixed levels, single-trade limit and timed exit were followed. A weakness remains: a bullish candle by itself is a very limited entry rationale, especially after the decline visible to the left of the entry. A small positive result does not resolve that weakness. We kept the original rule and did not optimise it using this outcome.
Limits and how to repeat the exercise honestly
One trade cannot estimate a dependable win rate or expected return. HistData bid prices and this simulator omit spread, commissions, slippage and financing; the 6 USD gain is not a net live-trading return and costs could materially change it. Candles do not reveal the order of every intrabar price movement. ReplayPip applies the stop first if both SL and TP are touched in one candle, although that did not occur here.
The local run was checked against the stored minute data after the outcome: all 14 five-minute candles from 09:00 through 10:05 matched the UI. No prices were changed for the article. Save your own journal, including skipped setups and losses, and keep the same rule version across further dates. If you revise the rule, evaluate it on another period rather than presenting this single result as validation.
Keep a record you can review with the forex backtesting journal template. Copy the fields into your own spreadsheet before resetting the replay.