PRACTICE JOURNAL
Forex backtesting journal template for a spreadsheet
The first useful journal entry is often a sentence, not a formula: what am I trying to test? Start with a small spreadsheet that lets you reconstruct the decision. ReplayPip saves the current session locally in your browser, but that save can be cleared or replaced. Keep your own journal as a separate record across sessions and devices.
Write the rule before the outcome
Create a rule-version column, such as A1. Describe entry, stop placement and exit conditions in a note beside the sheet. For each replay opportunity, record which version you followed. If you change the rule, start a new version rather than mixing old and new decisions into one set of results. That gives a losing example somewhere useful to go: it becomes an observation about a particular rule, not a reason to rewrite your whole history.
For a repeatable process rather than an unstructured playback, use the step-by-step manual backtesting guide.
Keep a row you can reconstruct
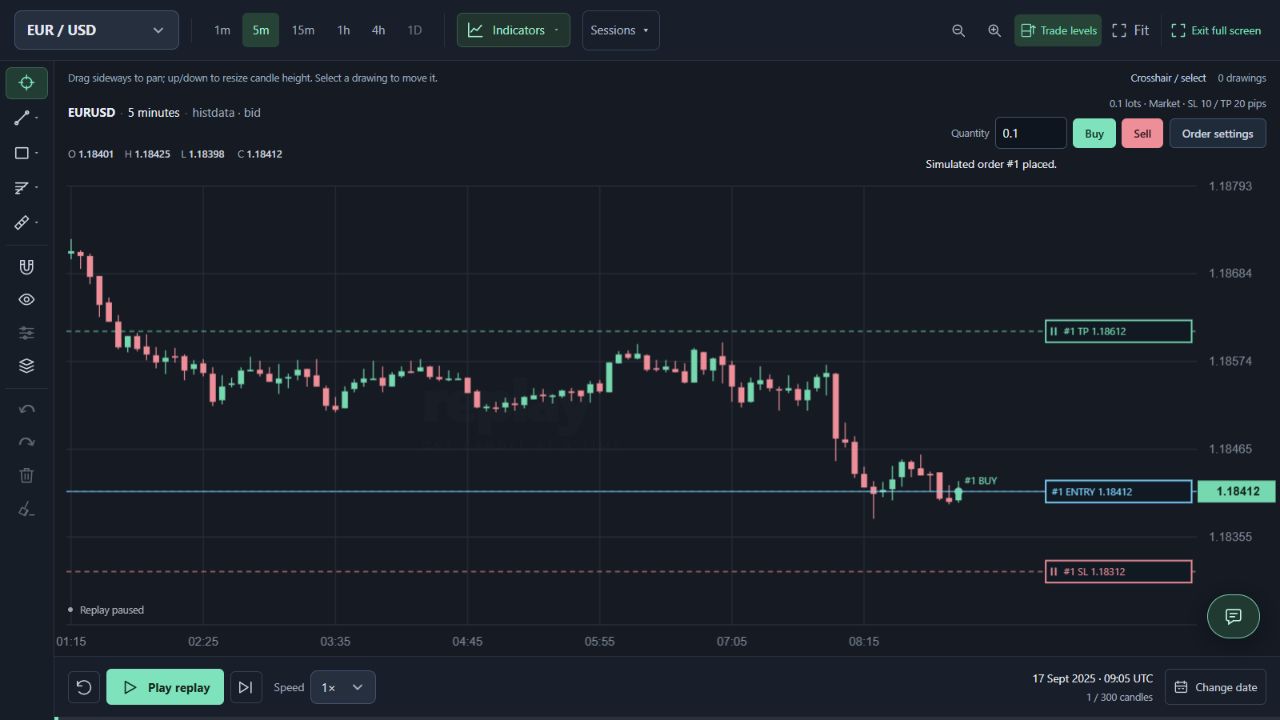
Use these headings as a starting point: pair, chart date and time in UTC, timeframe, rule version, direction, entry, initial SL, initial TP, position size, risk budget, exit, simulated result, rules followed and review note. The example row below deliberately leaves the outcome blank. The prices and 100 USD budget are hypothetical; they are not a recorded trade or a recommended risk amount.
| Pair / UTC date | Entry / SL / TP | Risk budget | Rules followed? | Result / review |
|---|---|---|---|---|
| EURUSD Record the chart date | 1.10000 / 1.09800 / 1.10400 | 100 USD | Yes / No + reason | Record after replay |
Separate the decision from the money
Give rules followed its own column. A Yes or No with a short reason is more informative than colouring every profitable row green. Also record valid setups you skipped and trades you took without a setup. Otherwise the sheet may quietly exclude the decisions you most need to inspect. Keep the original plan visible when you later add an exit note; do not overwrite it with the levels you wished you had used.
Label the result and its assumptions
If you use R as a review unit, write your definition. One possible definition is simulated profit or loss divided by the initial planned price-risk budget. With a 100 USD initial budget, a hypothetical 200 USD result is +2R and a 100 USD loss is −1R. A gap can make a loss larger than 1R. Never silently change the denominator after moving a stop. Keep USD and USDT results separate, and label all figures as simulation results without trading costs.
Before interpreting profit or loss, read why replay results differ from live trading, including candles that touch both the stop and target.
End with one review question
After a session, read the notes before summing the result. Look for repeated decisions: missing a valid entry, changing the stop, or entering during a period your rules excluded. Choose one behaviour to watch in the next session. A small batch of trades can reveal a process problem, but it cannot establish a reliable win rate or future profitability. Save the spreadsheet before changing the replay, and keep chart dates in UTC so you can find the same period again.