SESSION PRACTICE
New York session backtesting: replay a EUR/USD trade plan
Use a New York-session replay to test whether you can follow a defined process around a chosen time window. This tutorial separates the session overlay, the historical chart clock and simulated order rules. The example is educational and makes no claim about future returns.
Set the New York reference window
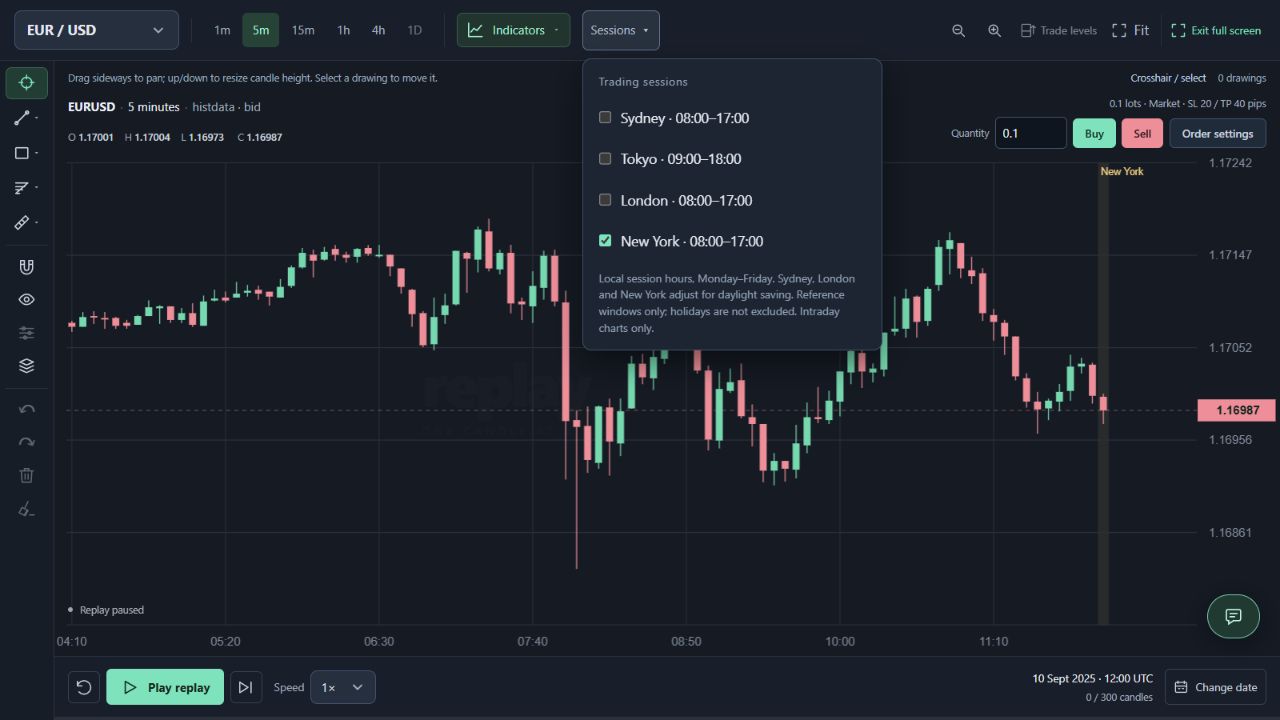
Choose EUR/USD and a weekday within the available stored history. Pause playback, select an intraday timeframe and enable New York under Sessions. ReplayPip shades 08:00–17:00 in America/New_York using the historical daylight saving offset. This is a reference window rather than a guarantee that a market or broker is open; holidays are not removed.
Check the date-specific UTC conversion
On 10 September 2025, 08:00 New York is 12:00 UTC, as shown in the capture. During standard time it is normally 13:00 UTC. London and New York do not always change clocks on the same date, so do not assume their overlap is identical all year. Chart candles and higher-timeframe boundaries remain in UTC. Write the local window and its UTC equivalent before choosing your starting point.
Define a test that includes reasons to skip
For a hypothetical pullback exercise, mark a level visible before 08:00 New York. Define the qualifying candle close, stop placement and target before advancing. Limit the observation window to 08:00–10:00 local time and record no-setup sessions too. If your rule excludes economic releases, verify the actual historical release schedule separately: the current Economic Calendar is not synchronised to the replay date and is not a complete historical news archive.
Calculate an example without mistaking it for evidence
Imagine a planned short at 1.10000, an initial stop at 1.10200 and a target at 1.09600. Those distances are 20 and 40 EUR/USD pips. With 0.10 lots, the simplified initial price risk is 10,000 × 0.00200 = 20 USD before costs and gaps. These levels are invented and independent of the capture. Sell / Short uses the revealed candle close; use Pending entry if the planned entry has not been reached. Check all levels in the simulated trades table.
Review fills and changes to the plan
Advance one candle at a time and write down when the setup qualified, the order filled and the position exited. Keep the initial SL and TP in the journal even if you later adjust them. Stop first applies when one candle touches both levels. Missing minutes are not invented, and spread, commissions and slippage are omitted. A smooth simulation cannot establish what would have happened at a broker around an announcement.
Compare repeatable decisions, then evaluate another period
Track rule version, pair, UTC time, timeframe, original risk, exit reason and a short process note. Keep USD forex results separate from USDT crypto results. Review multiple dates without selecting only attractive charts. Reserve a separate historical period for evaluating any revised rule. Browser recovery is convenient, but keep an external journal for a lasting record. Session-based practice is a way to investigate a method, not proof of profitability.
Keep a record you can review with the forex backtesting journal template. Copy the fields into your own spreadsheet before resetting the replay.