INDICATOR DATA WORKSHOP
Does your indicator have enough history? A worked SMA 20 example
An empty indicator value is not necessarily a broken chart. A 20-period simple moving average needs twenty completed closing prices. We isolated 25 five-minute EUR/USD bars from our saved 24 September 2025 dataset, calculated the average by hand and checked it against ReplayPip’s indicator function. The CSV lets you inspect every input rather than trust a drawn line.
Declare the window and what it excludes
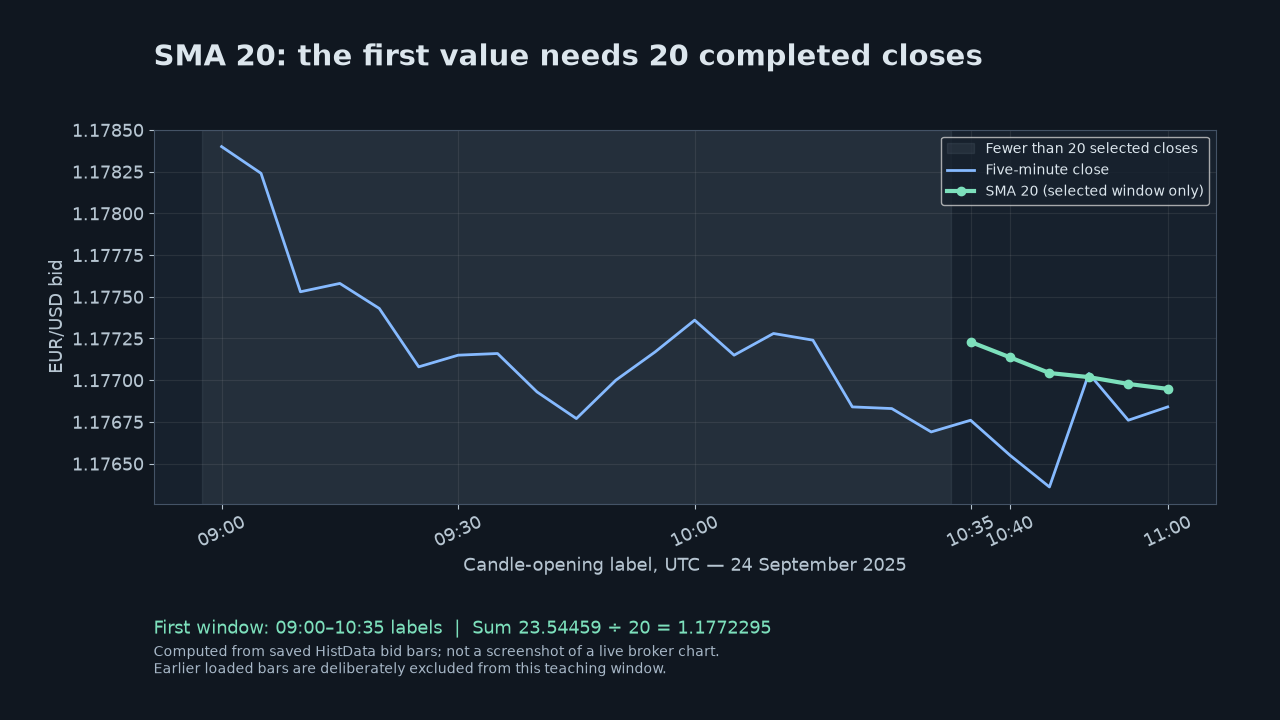
Use EUR/USD, HistData bid prices, five-minute complete candles and 24 September 2025. Our teaching window starts with the candle labelled 09:00 UTC. It comes from the same saved source bars used in our ten-session exercise, but this is a calculation check rather than another performance test. No claim about an entry signal is being tested.
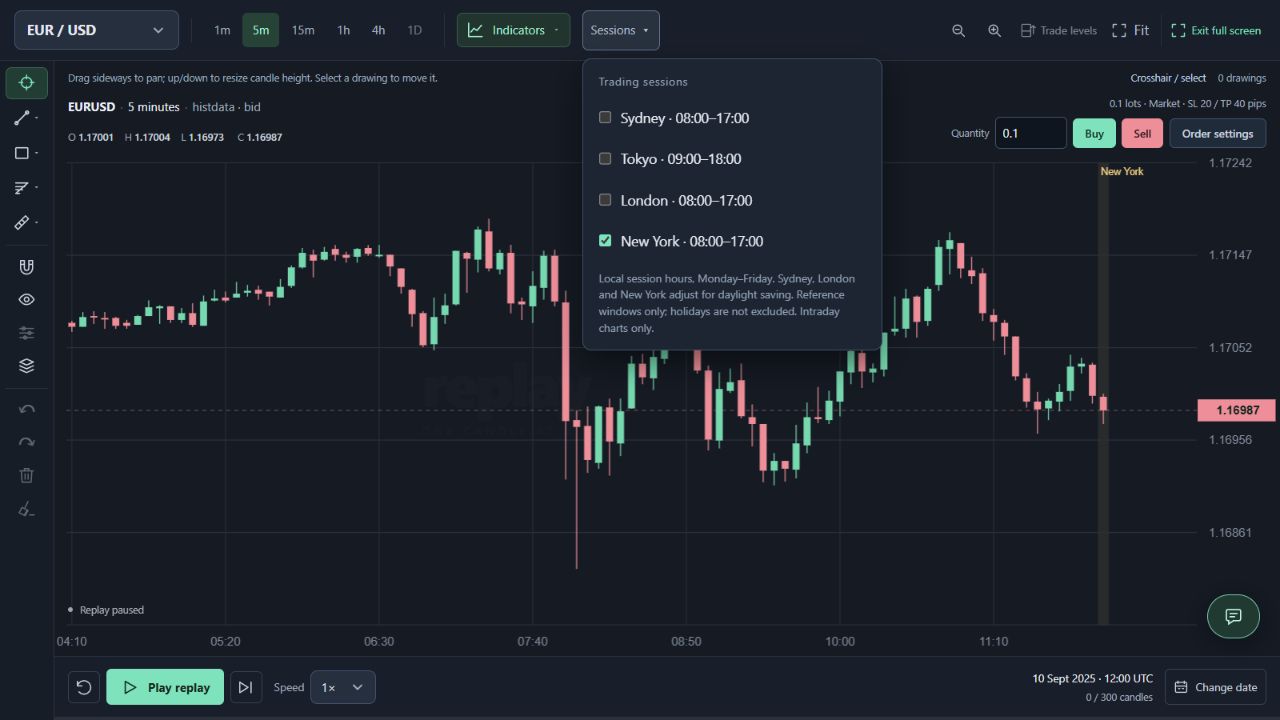
Importantly, the normal chart can load earlier candles before the chosen replay start. Its SMA can therefore already exist at 09:00. Our deliberately shortened input is not a claim that the real dataset begins then, or that every user should wait until 10:35. Compare input windows before reporting a discrepancy between the plotted example and the interface.
Testing one setup across ten replay sessions: keep the whole journal
Build the first average from twenty closes
An SMA 20 adds the latest twenty completed closes and divides by twenty. In this selected window the first twenty candle-opening labels run from 09:00 through 10:35 UTC. Their closes sum to 23.54459, so the first complete average is 23.54459 ÷ 20 = 1.1772295.
Those twenty five-minute intervals cover 100 minutes, ending at 10:40. The close of the candle labelled 10:35 is not known at 10:35 itself. Our indicator check uses the same completed-candle convention as replay; calculating a decision from that close before the interval finishes would introduce information from the future.
Roll the window forward by one candle
The next candle is labelled 10:40 and closes at 1.17655. Remove the first close, 1.17840, from the old sum and add the new close: (23.54459 − 1.17840 + 1.17655) ÷ 20 = 1.1771370. Nineteen observations are shared, but the oldest one leaves the window. Keeping all twenty-one prices and dividing by twenty would not be an SMA 20.
In the CSV, column B contains closes and column C the computed SMA. With an English-language spreadsheet, =AVERAGE(B2:B21) reproduces the first value and =AVERAGE(B3:B22) the next. Localised spreadsheet installations may translate function names or use different decimal conventions; preserve the actual numeric values when importing the file.
| Closes available | Last label UTC | Last close | SMA 20 |
|---|---|---|---|
| 19 | 10:30 | 1.17669 | — |
| 20 | 10:35 | 1.17676 | 1.1772295 |
| 21 | 10:40 | 1.17655 | 1.1771370 |
Distinguish unavailable values from zero prices
For the first nineteen inputs, the indicator function returns null because it has fewer than twenty finite closes. A null value means no defined SMA point in this window, not a zero exchange rate. Padding the missing inputs with zero or dividing a shorter sum by twenty would create a misleading low line.
Our verification also calculates the first twenty observations without the later five. The first valid result stays the same. This checks that the calculation is causal for this recorded sequence: later candles are not used to revise an earlier SMA. It does not establish that a moving-average strategy predicts anything, or verify every possible indicator configuration.
A period counts bars, not a fixed number of hours
Twenty five-minute bars span 100 minutes when contiguous. Twenty fifteen-minute bars span 300 minutes. Switching timeframe changes the inputs as well as the clock span: a fifteen-minute close is the last close of that complete fifteen-minute bucket, not the average of its three five-minute closes.
Missing bars complicate the clock interpretation. Twenty stored observations can span longer than 100 minutes if timestamps contain gaps. An average over the values alone does not repair missing time. Inspect coverage first, keep incomplete higher-timeframe buckets out of the exercise and record the policy rather than silently inserting replacement prices.
Why missing candles affect your backtest—and how to check them
Reproduce the check before changing a strategy
Download the CSV, confirm the first nineteen SMA cells are empty and inspect the 10:35 and 10:40 rows. Plot close and SMA as separate series, then shorten the input to nineteen rows: no SMA 20 should exist. Record the pair, basis, interval, input start and period when comparing another platform.
Our plot is generated from saved bars and the numerical results are checked against ReplayPip’s actual indicator function. The chart may round its label differently from the seven-decimal worksheet, so compare unrounded values with a small numerical tolerance. An SMA is a summary of past closes; the example makes no claim that adding it produces profitable trades.